







Part 1 of the 4-part series -Cloud monitoring for Cisco Catalyst Switches Series
'Tis the season for trickery, but also delicious treats. This blog is mostly about treats-namely switches and your network (disclaimer: your switches aren't candy-don't eat them).
However, let's start with the trickery. I don't know much about witches, only what I learned from movies like Hocus Pocus. But I do know about network tricks-the kind that sneaks up on you from the complexity of having hundreds of switches, thousands of access points, and who knows what else. It probably depends on the day.
Networks are changing fast. There's a more nefarious activity in the world so you always need to be thinking about the next best or more secure solution. Besides security, your network traffic has increased and your data center has changed from a centralized "headquarters" to a more distributed workhorse with more devices and more demands on your network.
There are new technologies coming into play too. Heatmaps of space use sensors that can tell you basically anything you want to know about your hybrid workspace, and electronic shelf labels (ESL) via Bluetooth? Low Energy will change labels based on a multitude of inputs. The complexity of networking is only growing. Can you say you've seen it slow in the last decade? I can't.
In order to keep up with changing demands on your network, you need to think about how to scale and become future-proof. That starts with your journey to the cloud. Even if you're not ready today, you should still be cloud curious (as I like to say) and planning for, at minimum, a hybrid environment. The most important step to your journey to the cloud starts with visibility.
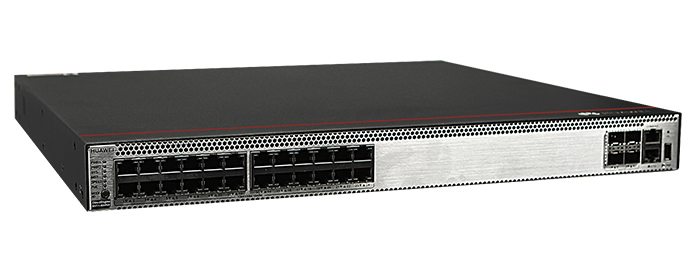
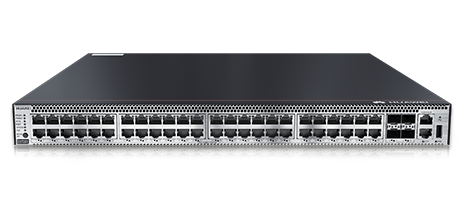
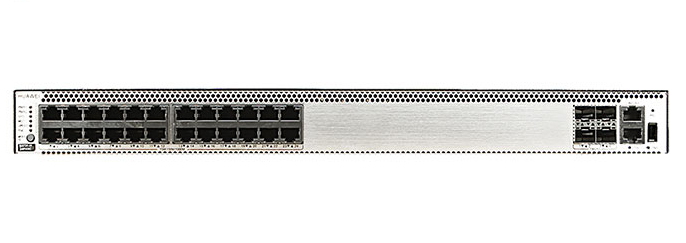
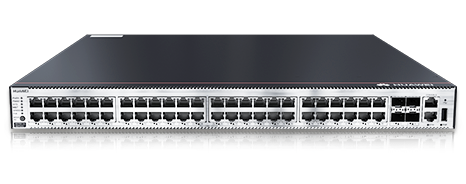
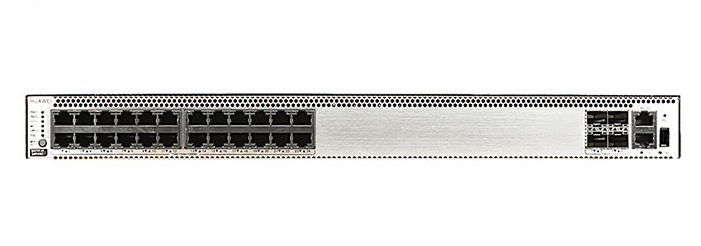
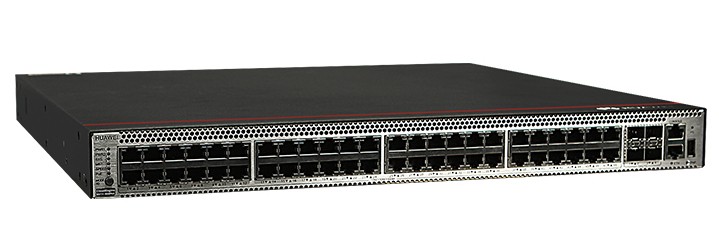
As a Catalyst customer, you can now monitor your 9500, 9300, and 9200 switches at the heart of your network in real time in the Meraki dashboard Monitoring your switches will help you learn the dashboard and get ready for what's next as your network grows and becomes less centralized. It's a witchingly powerful way to scale how you operate without adding complexity. And as my friend and colleague explains in this blog, it's so easy, you'll be up and running before you can even say, "Witches get switches!"
As a final note and extra treat (no mediocre candy corn, this is a full-sized chocolate bar moment): it's more than visibility. Cloud monitoring gives you insight into network topology, including client and port-level configurations. It even includes traffic inspection and some light troubleshooting tools. This means you'll be able to see and isolate and fix issues all from the comfort of your recliner while you watch Halloween movies, rather than having to go on-site. Quite the delicious treat indeed.
If you're ready now-great! Here's our getting started guide.
Also, check back in a month for my next blog. We'll dive a bit deeper into what you can visualize in the Meraki dashboard. Switches are just the beginning!
Happy Halloween! And happy monitoring!
Join our November 15th webinar to learn more and ask questions!
Your Four-Step Guide to Enabling Cloud-Managed Networks
Nov 15, 2022 10:00 am -11:00 am PST (GMT -08:00)
 Tags quentes :
Cisco Meraki
Meraki Dashboard
Cisco Catalyst Switches
Cloud Monitoring for Catalyst
cloud management for Catalyst
Cisco Catalyst 9000 Series
Cloud monitoring for Cisco Catalyst Switches Series