











I recently did a project involving several moving parts, including Splunk, VMware vSphere, Cisco UCS servers, EMC XtremSF cards, ScaleIO and Isilon. The project goal was to verify the functionality and performance of EMC storage together with Splunk. The results of the project can be applied to a basic physical installation of Splunk, and I added VMware virtualization and scale-out storage to make sure we covered all bases. And I'd now like to share the project results with you, my dear readers.
Splunk is a great engine for collecting, indexing, analyzing, and visualizing data. What kind of data you ask? Pretty much everything you think of, including machine data, logs, billing records, click streams, performance metrics and performance data. It's very easy to add your own metric that you want to measure, all it takes is a file or a stream of data that you enter into your Splunk indexers. When all that data has been indexed (which it does very rapidly as seen in my earlier blog post), it becomes searchable and useful to you and your organization.
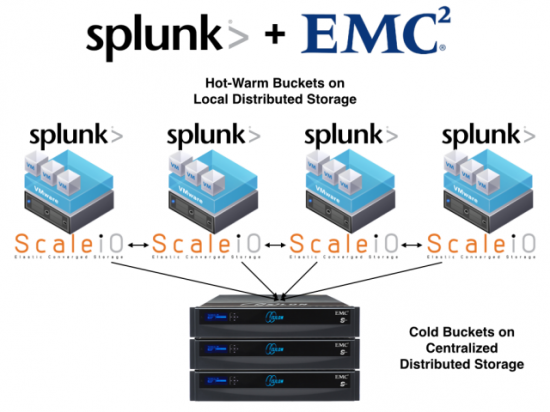
We wanted to try the Hot and Cold bucket strategy that Splunk uses for Hot and Cold data. Hot data is usually the data that just came in, so recent (and most often most important) data. Cold data is usually older data, but definitely not stale, as you can and most probably will be doing a lot of searches against it. As you can imagine, the Cold buckets will become many times larger than the Hot buckets, so we wanted to see if we could use two different scale-out storage technologies for this to make sure we don't have any single-point-of-failure anywhere in the Splunk solution.
We used EMC ScaleIO as the Hot bucket layer, where we wanted the most performance for both ingesting and indexing new data as well as searching on that new data. We then used EMC Isilon as the Cold bucket layer, as we wanted to be able to scale that to many hundreds of TBs or even several PBs. We also included VMware vSphere on top of Cisco UCS servers as the underlying hypervisor for both the Splunk servers and the ScaleIO storage system. To be able to handle the load of incoming data, you have to make sure you have enough CPU and networking power for your servers. The Cisco UCS servers we used definitely provided that, and made sure we could get those impressive numbers you see below. We gave each ScaleIO server an XtremSF card as storage, and off we went.
You can visualize the Splunk servers connected to the ScaleIO storage as a "Hot Edge", and the Isilon environment as the "Cold Core" (3rd platform lingo). This made it easy for us to remove the SPOF that sometimes comes with a Splunk environment, where data is only stored locally instead of spread out as in the ScaleIO and Isilon cases. This gives Splunk admins less of a headache during server failures or regular maintenance, as any and all data can be accessible from any Splunk server if so wanted and/or needed.
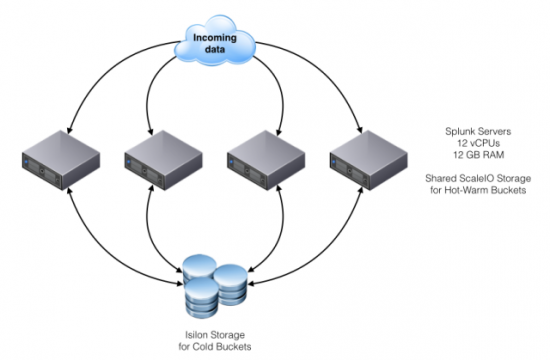
When creating a Splunk storage model like this, where Hot and Cold buckets are divided into different storage solutions, the performance and cost tiers are also divided. That means that a customer who only wants more Hot storage can easily add more HDDs/SSDs/Flash drives/Splunk servers, or if they need more Cold storage they could easily add a new Isilon node on the fly without any downtime of the Splunk environment.
The result of this project was that we in the end had an incredibly high performance Hot bucket layer, together with an extremely scaling Cold bucket layer, so we could be prepared to meet pretty much any customer's need in both performance and scale.
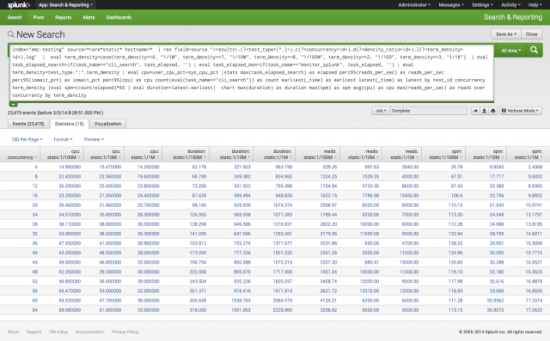
And boy did we see performance. Look at the following screenshot taken from Splunk itself regarding the performance we got.
spm = Searches per minute
duration = Total test duration
reads = Total reads per second (read/s as reported by linux tool sar/OS) cpu = Total user cpu + sys cpu
Click on the image to get to an enlarged version.
For more information on how the solution was built out and how you can create it yourself (or with the help of an EMC SE), see this link.
 Tags quentes :
Cisco UCS
#CiscoChampion
Splunk
EMC
VMware vSphere