










Introducingversion 3of theCisco Meraki Add-on for Splunk.
Download Add-on
A Splunk technical add-on (TA)isa modular component that normalizes, validates, and enriches specific data sources before indexing in Splunk to enable proper searching, reporting, and analysis without changing the underlying raw data.
Keeping track of your networks shouldn't feel like detective work. But when you've got multiple Meraki organizations, various vendors, security concerns, and performance issues to monitor, it can get overwhelming. That's wherethe Cisco Meraki Add-on for Splunkcomes in-it simplifies network observability by bringing your key data and metrics intoone easy-to-use platform.
TheMeraki TA helps you to:
Unify your network insightsacross multiple Meraki organizations.
Monitor security and application dataalongside infrastructure health and over extended periods of time.
Create custom dashboards and automate responsesto network events.
In v2, the Add-on provided data inputs focused on:
Security & Event Monitoring-Trackorganization-wide security events, Air Marshal detections, and network device logs.
Infrastructure Insights-Get data onaccess points, cameras, security appliances, and switches.
Configuration Tracking-Seeaudit logs of organization configuration changes.
We've expanded theMeraki Add-onwith even more capabilities. Here's what's available now.
Device & Network Insights
Top Usage & Performance Rankings
Advanced Assurance & API Analytics
SD-WAN & Cellular Gateway Monitoring
Licensing & Firmware Management
The add-on keeps the Meraki data in sync with Splunk via:
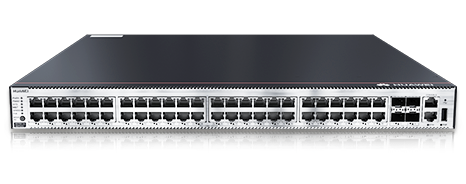
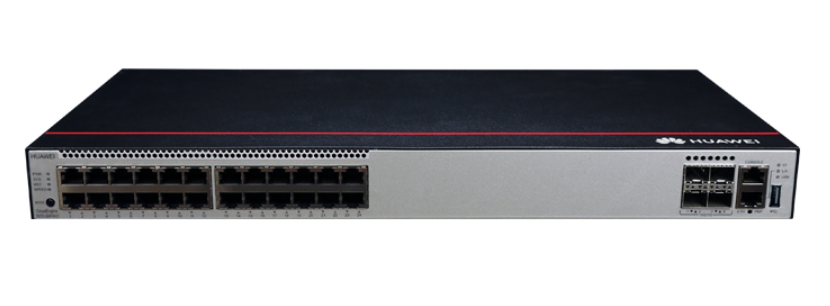
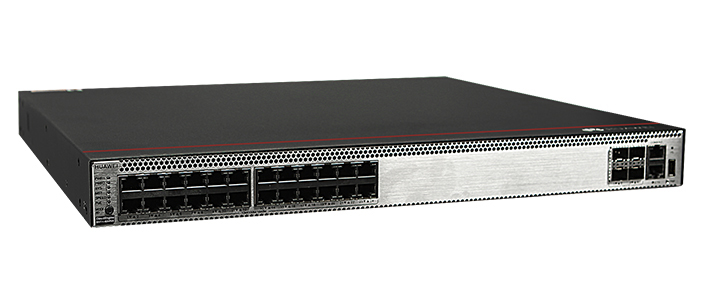
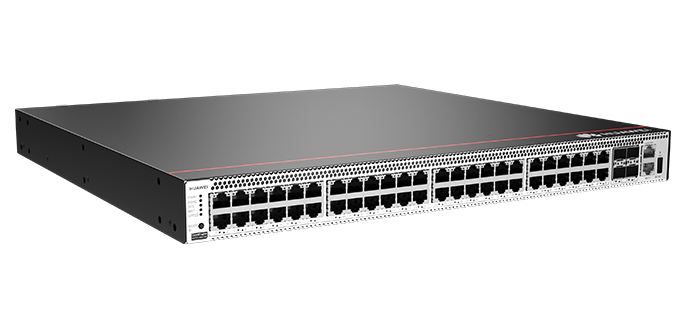
We also made sure it supports the Meraki "full stack" of Cisco networking equipment.
The Meraki Splunk Add-on is freeand available now onSplunkbase.
Just install it and connect your Meraki organization(s) with an API key.
Read the documentation for complete details.
1??Add your Meraki organization(s).
2??Choose the data you want to feed into Splunk.
3??Search, Discover and Visualize!
There are a number of sample visualizations provided in the add-on. You can use these as-is or for inspiration while creating your own custom dashboard.
Monitor device uptime and network performance.
Monitor the VPN connectivity across networks.
Great for figuring out rate-limit and application errors.
Identify heavy electricity usage.
Observability doesn't have to be complex. WithMeraki & Splunk, you canspot issues faster, automate smarter, and manage better.
Stay tuned for more to come!
Download Add-on Tags quentes :