Cadastre-se agora para um orçamento mais personalizado!


Cisco has long provided security services for third party events such as the Black Hat and RSA Conferences, as well as the Super Bowl and the Olympic games. These services come in the form of products (Cisco Security Cloud capabilities, including Umbrella, XDR, Malware Analytics, etc. plus Splunk Enterprise Security); and skilled Security Operations Centre (SOC) analysts, who build and operate the infrastructure and hunt for threats, from both inside and outside the event networks.
For the second time at Cisco Live APJC, the team was tapped to support the Cisco Live Melbourne 2024 conference. This report serves as a summary of the design, deployment, and operation of the network, as well as some of the more interesting findings from four days of threat hunting on the network.
The Cisco Live Security Operations Centre (SOC) has a mandate to ensure access to event services is delivered securely. Achieving this goal requires monitoring and interacting with multiple products to get the data needed.
Receiving data in many forms from the network and devices allows the SOC to curate that data to be able to better discern what is actually happening in the environment. We need summarized information to initiate triage, but the ability to forensically investigate in certain cases.
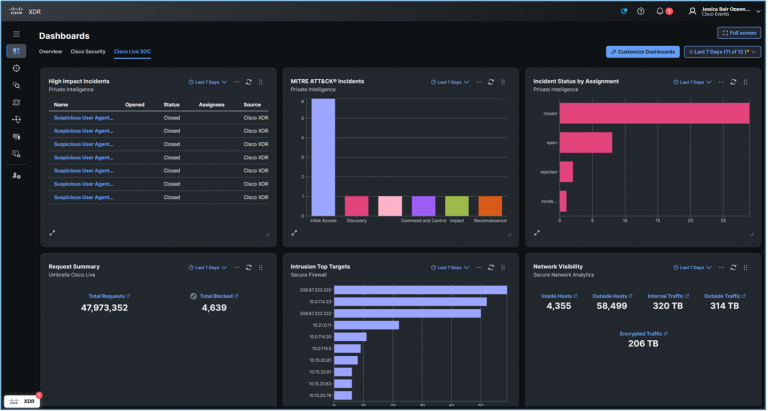
To better understand the scale of the operation that is Cisco live APJC, have a look at the following statistics for the 4 Days of the conference
DNS Total Queries: 48,123,933
DNS Queries Sinkholed: 4,750
Classified Applications: 11,614
Risky applications: 300+
Inside total traffic: 320TB
Encrypted Traffic: 206TB
Traffic to Outside: 314TB
Inside Unique Hosts: 4355
Outside Unique Hosts: 58349
Cisco Live event Environment:
"The Right Tool for the Right Job"
Bumping into the environment occurred the week before the event but required months of preplanning. This included the logistics of staffing, floor layout, cloud Service builds, equipment shipping, marketing liaising and tour registration, escalation process with the NOC Staff, and incorporating lessons learned from previous events. Not to mention shift rosters and event passes.
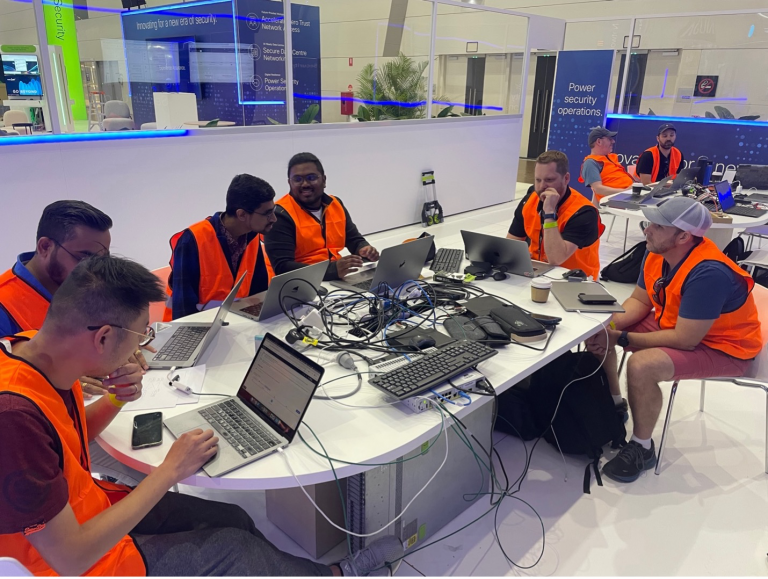
We proved a fourteen hour coverage in 2 shifts, with "eyes on screen" from 8 am until 6pm.
There were at least four stations chaired each with primary focus of TRIAGE, SANDBOX, EVENTING, and SIEM/Forensics.
All staff rotated through these chairs, with ancillary staff performing threat hunting duties and creating automations.
Senior Analysts and Interns alike shared experience and knowledge like trading cards. We all learned from each other and the happy supportive environment maintained itself. The environment not only served to protect the attendees but also allows us to "beat up on" the platforms and show them in use, collecting feedback to provide to the developers all the while learning and honing our analyst skills.
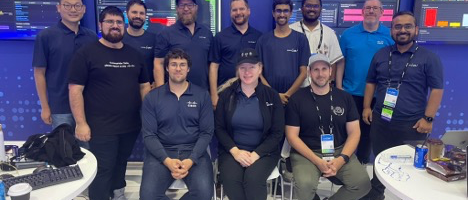
Senior Analysts
Christian Clasen, Justin Murphy, Aditya Raghavan, Adam Kilgore, Tony Iacobelli, Jessica Oppenheimer
Intern Analysts
Cam Dunn, Milin Mistry, Ricky Mok, Zoltan Karczag, Alex Chan
SOC Leads
Shaun Coulter, Aditya Sankar, Ryan MacLennan
NOC Leads
Freddy Bello, Andy Phillips
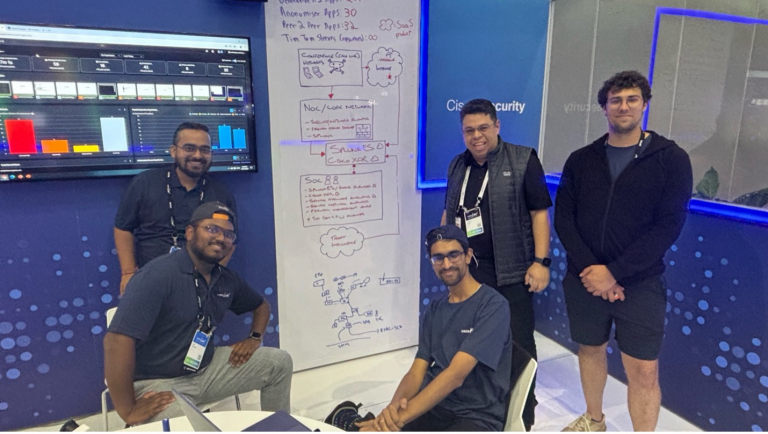
During the event we provided fourteen SOC tours which were attended by a total of 140 people. The tour talk was to define the purpose of the SOC at that event, how we operate, and some interesting stories of what we had found.
The SOC staff rotated through delivering these talks and interesting finds through the conference.
The rest of this blog is a written version of those SOC tour talks, starting with the build and operation, the components, and our analyst stories. Enjoy!
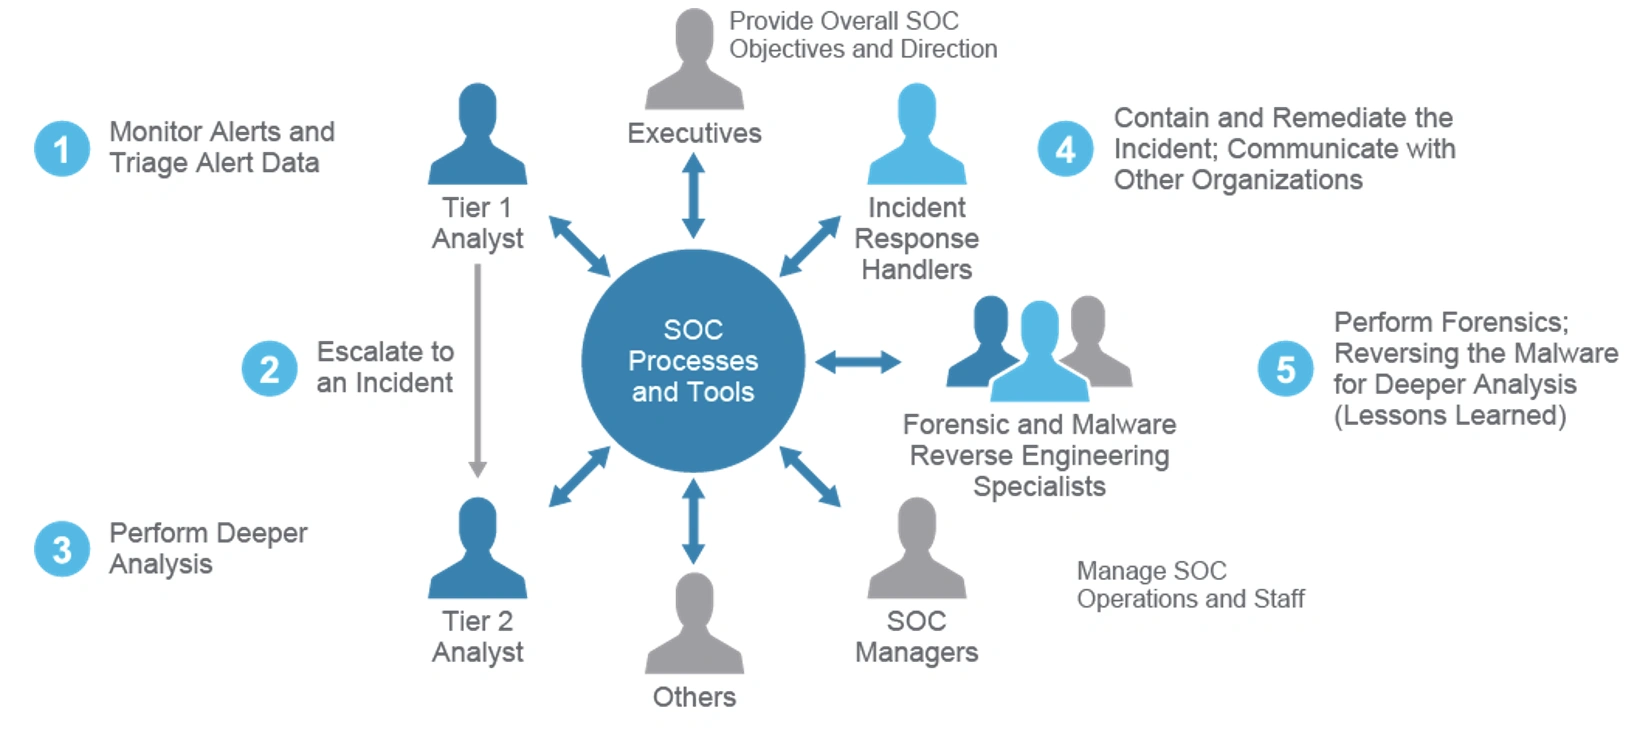
We operate a triage tier to provide a summary view utilizing Cisco XDR and deeper forensics with Splunk Enterprise Security. This approach allows us to rapidly understand the risk and breadth of an incident, and mine the data deeply for cases with higher complexity.
With this approach XDR effectively performs the task of collecting data and putting it in context, as well as provide the appropriate playbook to deal with the incident as it stands. In the Cisco Live SOC this speeds up with work of Tier 1 triage.
Cisco XDR and Splunk ES are integrated together and receive relevant data from all conference infra. Specifically, the following products were deployed to provide relevant data:
On premise:
(Note the above platforms are available individually or packaged in Cisco Security Suites, refer to the following links for more details
The diagram below illustrates how the products are logically interconnected.
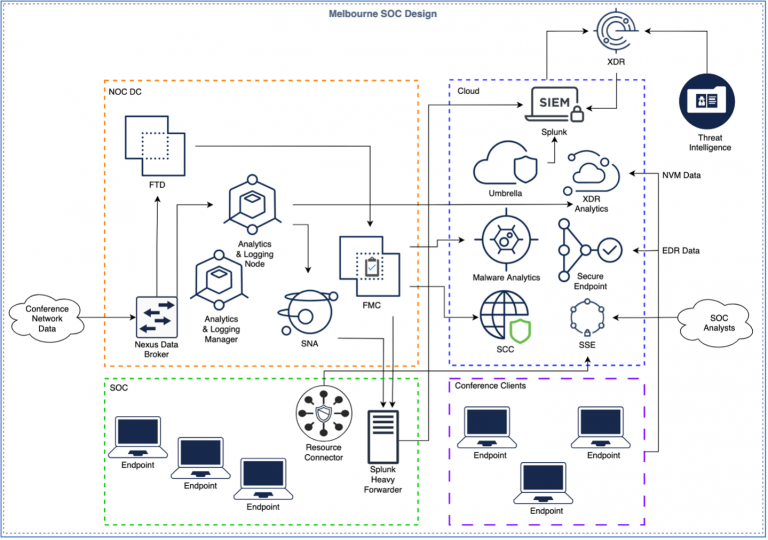
Looking at the image above we see the conference network data coming into the Network Operations Center's data center (DC) on the left side. The SOC is being fed the conference data via a Nexus Data Broker.
To the right of the NOC DC, we have our cloud-based products. Under the NOC DC there is a green box with the SOC analysts in it. This is not only where we sit but also where we connect to our internal resources using Secure Access. We used the Secure Access Resource Connector to connect to internal resources like the Firewall Management Center (FMC) and Secure Network Analytics (SNA). This is further explored in the next section of the blog.
On the bottom right, we have Secure Client deployed on Windows machines around the conference to send NVM and EDR data to XDR and Secure Endpoint. Lastly, we have all the products in the orange dotted box sending data to XDR along with third-party threat intelligence feeds.
Within the NOC DC area, we have the Nexus Data Broker SPAN, providing that feed to a physical Secure Firewall Threat Defense (FTD) appliance. The FTD is managed using a virtual Firewall Management Center (FMC) and is not configured to enforce any security policy. Below is an overview of what was configured:
Following is a deeper look at each component.
Justin Murphy
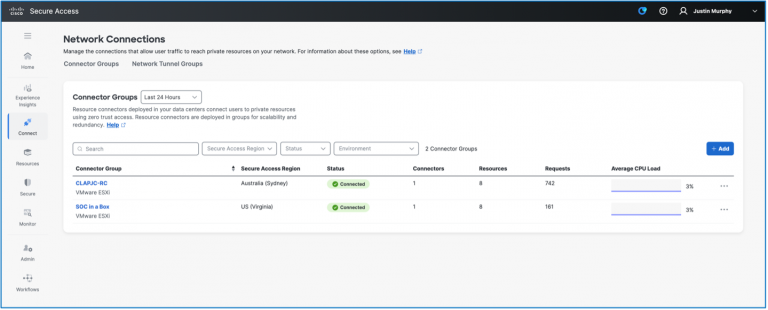
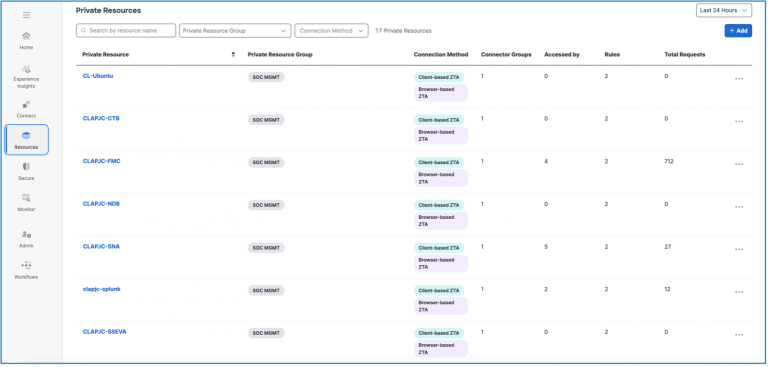
Cisco Secure Access (CSA) is Cisco's Secure Services Edge platform. In the SOC we are interested primarily in its capability to provide access to applications from anywhere to anywhere.
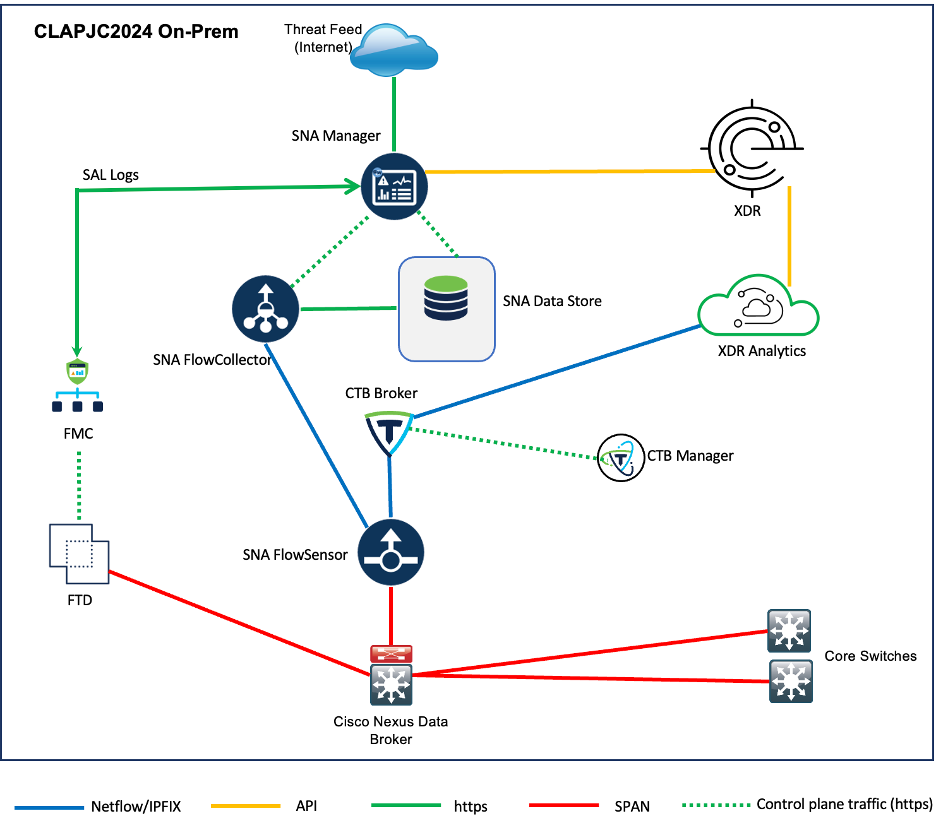
To that End, Cisco Secure Access was configured to provide access to the on-premises platforms. Namely: the Splunk forwarders, the SNA, the FTD, and the Telemetry Brokers.
The images show the configured resources that were accessed with CSA, with redundant connector groups or head ends, and the statistics of the accesses to each of the resources.
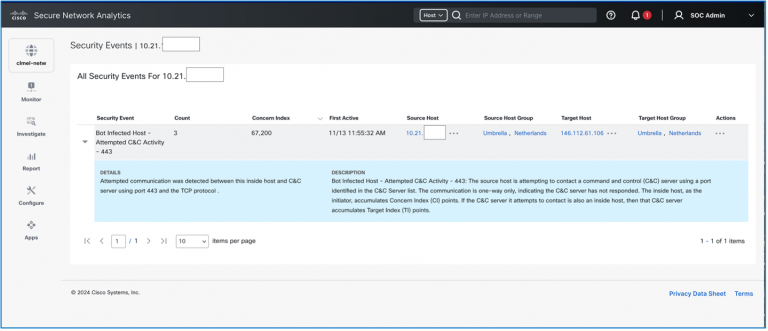
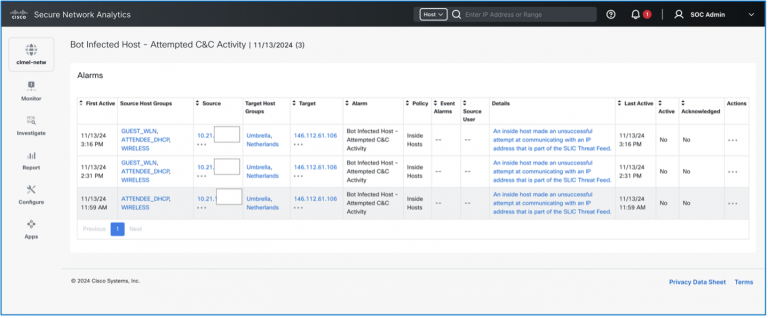
Cisco Secure Network Analytics (formerly known as Stealthwatch Enterprise) provides full visibility across the Conference network and uses advanced analytics to detect and respond to threats in real-time. These threats include command-and-control (C&C) attacks, distributed denial-of-service (DDoS) attacks, unknown malware, and insider threats.
Secure Network Analytics is integrated with Cisco XDR, Critical and Major security alarms are sent from the Security Services Exchange and analyzed by the current platform to support investigations. These alarms are converted into incidents, complete with details like sightings, observables, and indicators based on the alarm metadata.
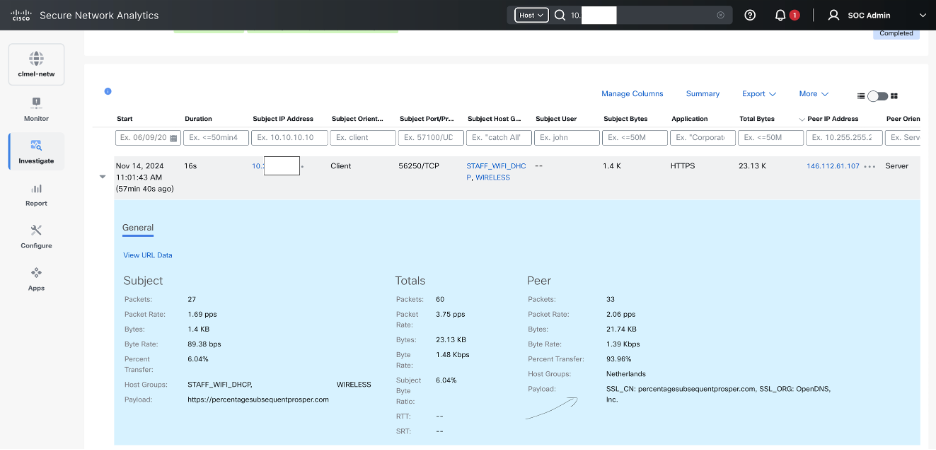
During an investigation, for every valid IP address requested, Secure Network Analytics provides:
In addition to standard fields contained in NetFlow/IPFIX records, the Secure network analytics FlowSensor also incorporates additional metadata from deep packet Inspection (DPI) for accurate layer-7 application identification, network, and server response time metrics, as well as limited packet payload information (including up to 256 bytes of HTTP and HTTPS request paths), which is used as required for forensic investigation.
Cisco XDR is a cloud-based solution designed to simplify security operations and empower security teams to detect, prioritize, and respond to sophisticated threats. In the Cisco Live SOC, XDR is used as the triage platform. XDR receives telemetry from all integrations, and performs an event aggregation and correlation, to produce an incident bundle. This is a different approach to a SIEM in that the search, risk analysis and collation of enough data to determine risk is an out-of-the-box operation. One could say it is more of a plug-and-play approach. Customization is available but not to the extent that our Splunk platform allows. We use XDR for Triage and Splunk ES for escalation. This works exceedingly well, and we are able to rapidly upskill interns to be operational, while allowing senior analysts to concentrate on process and automation improvement and escalations. This is "the right tool for the job" at work.
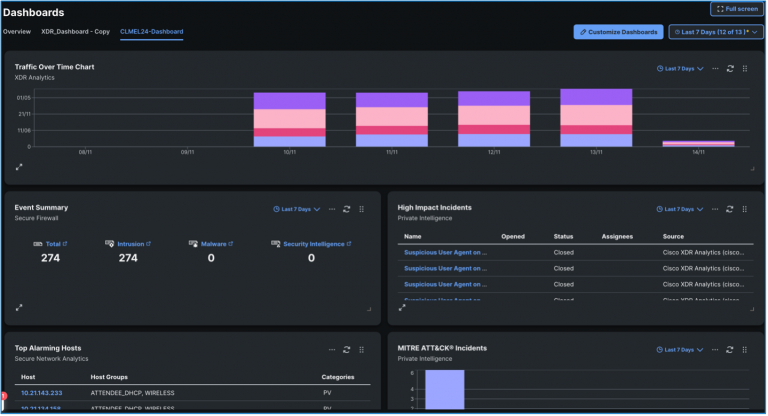
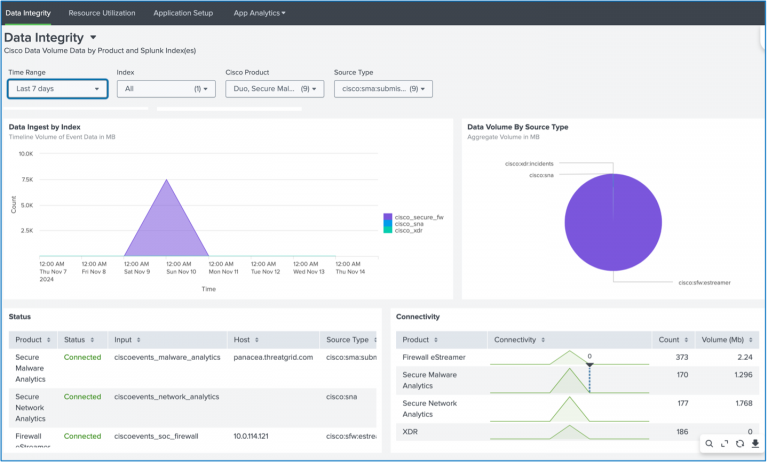
For the Cisco Live APJC 2024 SOC, a custom dashboard in the Control Center was built to highlight the findings from the various integrated solutions.
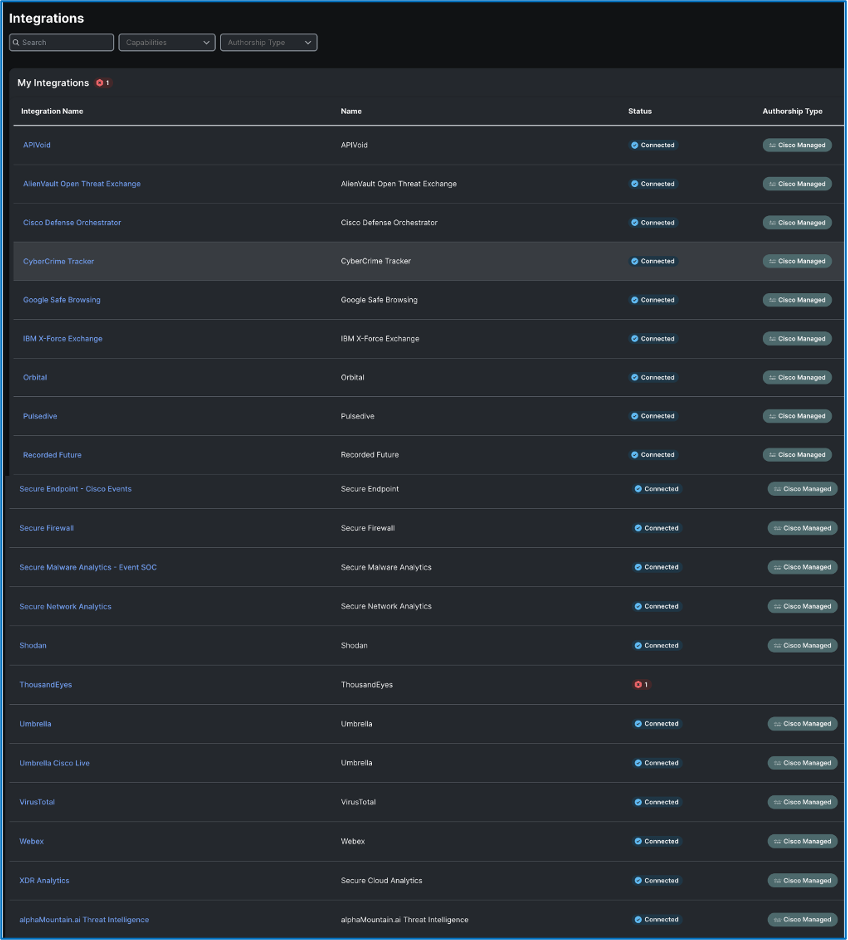
Following are the plug and play integrations which were configured in XDR:
| Cisco Integrations | 3rdParty Integrations |
|---|---|
| XDR Analytics (formerly Secure Cloud Analytics) | APIVoid |
| Secure Malware Analytics | AlienVault OTX |
| Secure Endpoint | Cyber Crime Tracker |
| Orbital | Google Safe Browsing |
| Cisco Defense Orchestrator | IBM X-Force Exchange |
| Umbrella | Pulse Dive |
| Secure Network Analytics | Recorded Future |
| Webex | Shodan |
| Thousand Eyes | Virus Total |
| Alpha Mountain Threat Intelligence |
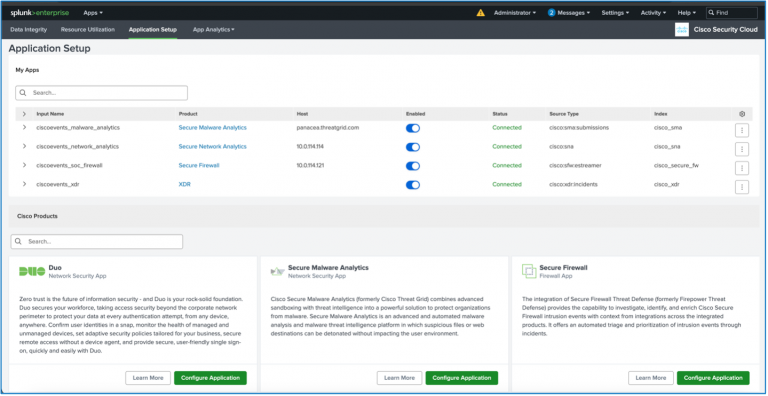
Our Splunk stack consisted of Splunk Cloud and Splunk Attack Analyzer. Splunk Cloud had Splunk Enterprise Security (ES) and the Cisco Security Cloud apps installed. Since our security tools include on-premises appliances like the Firewall Management Center and the Secure Network Analytics Manager we needed to be able to get the data from on-premises to the cloud. The solution was to stand up a UCS M3 server that we had on site. Once we got the server online, we deployed a small Ubuntu virtual machine and installed Splunk on it.
The Cisco Security Cloud app, which is published on the Splunk base app store, is a single app to get data from Cisco Security tools into Splunk. The app is modular so individual products can be configured to ingest data into Splunk including Secure Malware Analytics, Firewall, Secure Network Analytics, Cisco XDR and more. The app includes a pre-configured dashboard for each product and health monitoring of the app to see how much data is being ingested. When data is ingested, the app transforms the data to a Common Information Model (CIM) which is Splunk's universal schema for indexing data. This allows us to create visualizations across multiple data sets or search for a single field across multiple telemetry types.
With the Cisco Security Cloud app configured to ingest data from our various sources we then installed the universal forwarder app to connect to the Splunk cloud deployment. The universal forwarder was extremely performant and was able to forward gigs and gigs of data to Splunk cloud without ever exceeding 30% CPU or a reasonable ingest delay. This allowed us as SOC analysts to search data in Splunk cloud which is also where we had Enterprise Security installed. Incidents from XDR were automatically populated as notables in Splunk ES.
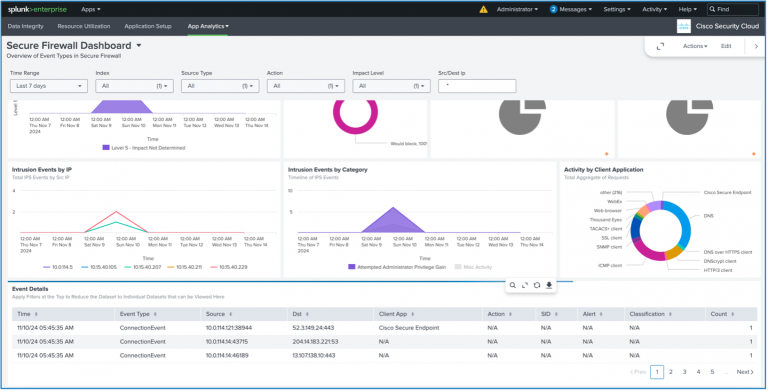
The Cisco Secure Firewall (CSF) deployment at Cisco Live Melbourne is an IDS deployment that receives a TAP from the existing network and security infrastructure used by the conference. CSF acts as the traffic ingestion point for the other security tools used by our SOC, collecting valuable data and generating logs and events that are used to inform products like Cisco Splunk and Cisco XDR. CSF also pulled files directly from unencrypted sessions, submitting them to Secure Malware Analytics for sandbox analysis.
Operating in passive IDS mode does have visibility drawbacks, as we lose the ability to use TLS Server Identity to pull additional information from HTTPS connections, and general decryption is off the table. However, the firewall still provides core alerting capabilities, and the dozens of datapoints captured for each connection proved key in many investigations, most notably covered in the 'Sifting Traffic with Secure Firewall' and 'Malware Callouts from the Show Floor' sections.
From a geolocation perspective, Cisco Live attendees showed a strong prevalence for connections back to the USA, dwarfing all other connection destinations.
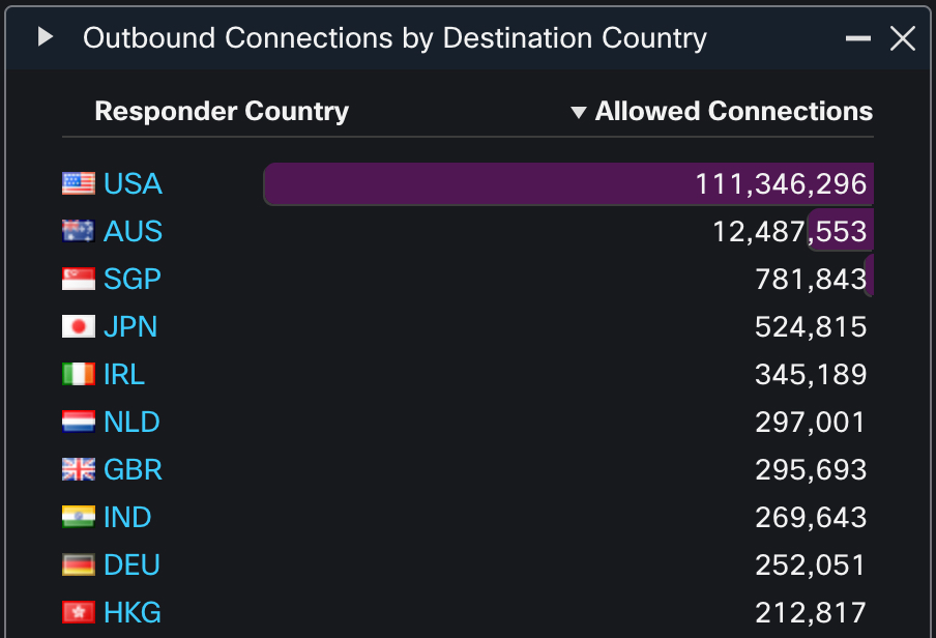
The home country of Australia also made a strong showing with twelve million connections. No other country cleared a million connections, but the rest of the list showed an unsurprising prevalence for regional and global tech hotspots. The predictability of geolocation preferences for the attendees allowed us to take a closer look at rarer inbound and outbound geolocation connections, which helped us expand multiple investigations as we looked for additional activity after finding one event. Of course, geolocation data for malicious activity can be faked using Tor, VPN, or a compromised host in another country, but traffic that blends in with expected geolocation patterns is still subjected to signature, heuristic, and sandbox analysis. Geolocation remains one of many characteristics that can reveal attack patterns.
Application data is another area that we monitor at a broad level, in addition to individual alerts for malicious domains. We continue to see plaintext attacks and plaintext information leaks at each conference, but the frequency of these has gradually decreased. At Cisco Live Melbourne 2024, we saw a 15:1 preference for HTTPS over HTTP. HTTP/3 also continues to grow in popularity.
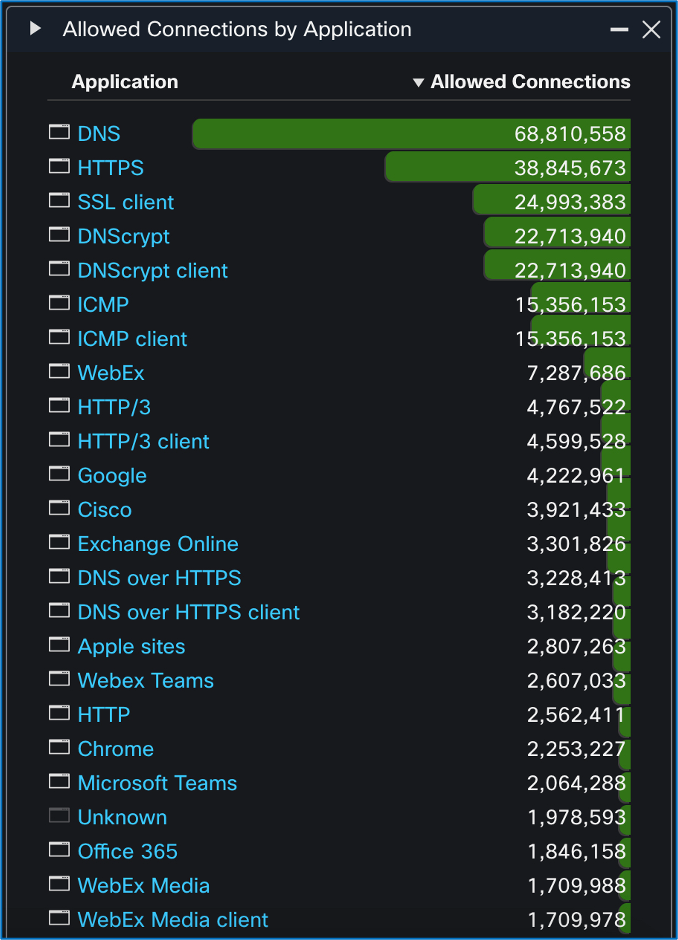
Also of note is the use of DNS over HTTPS to mask DNS requests. While the great majority of DNS requests continue to be plain text, the use of DNS over HTTPS continues to rise. Eventually, we expect to see plain text DNS requests overshadowed by encrypted DNS protocols, much like HTTP is eclipsed by HTTPS today.
By Aditya Raghavan
On the automation front, we introduced three new automation workflows to help speed up threat hunting for our analysts. Credit to Ivan Berlinson, our colleague from France, for the first two workflows in XDR automation with Secure Malware Analytics, and Adi Sankar for the workflow with Umbrella.
1. Malicious samples submitted in Secure Malware Analytics

We want to reduce the number of dashboards pivots our analysts deal with. So, for any samples submitted to Secure Malware Analytics that are convicted as malicious (threat score > 90) and seen in the Cisco Live environment, this automation workflow would automatically create an incident in XDR and send a Webex message to the Incidents channel. The above is an example. While this isn't something to do in a production environment every time, it is useful for bubbling up interesting avenues of investigations right in XDR and Webex to our analysts.
2. Non-malicious samples from common document formats

Similarly, we typically see some content transmitted in clear text at such events. Any documents with common file types submitted to Secure Malware Analytics having a non-malicious verdict (threat score < 85), seen in the Cisco Live environment and of the following types typically have content in clear text. This is worth an investigation for our analysts to identify if there was any critical information being leaked inadvertently. This workflow would automatically create an incident in XDR and send a Webex message to the Incidents channel for documents of the following file types.
3. Create incidents from Umbrella Security Events
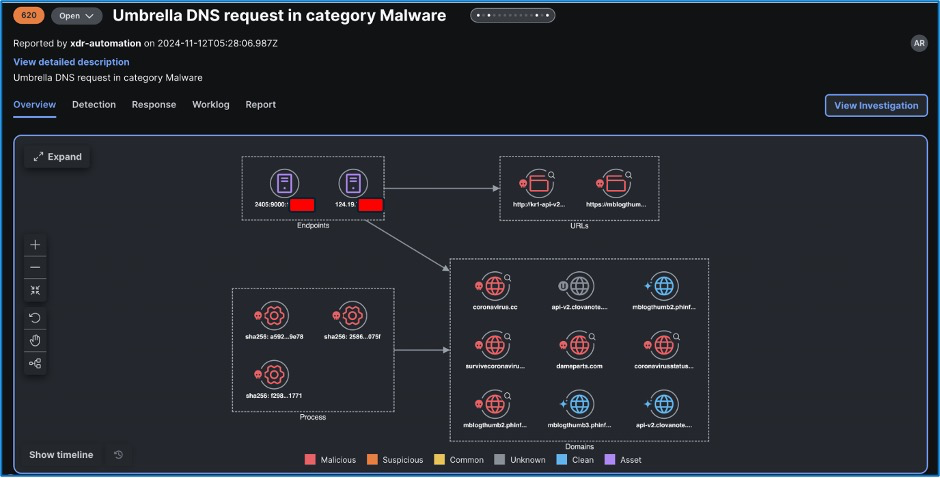
Any DNS Security Events in Umbrella for certain categories of interest would be brought forward to the analyst as an incident per category. This shows an example of an automation created incident for the Malware category.
Christian Clasen
A couple days into the conference we noticed several block events in Umbrella DNS. The events were TXT record queries for what appeared to be randomly generated subdomains belonging to ucmetrixsdn[.]info. The queries resemble the domain generation algorithm (DGA) technique commonly deployed for malware beaconing.
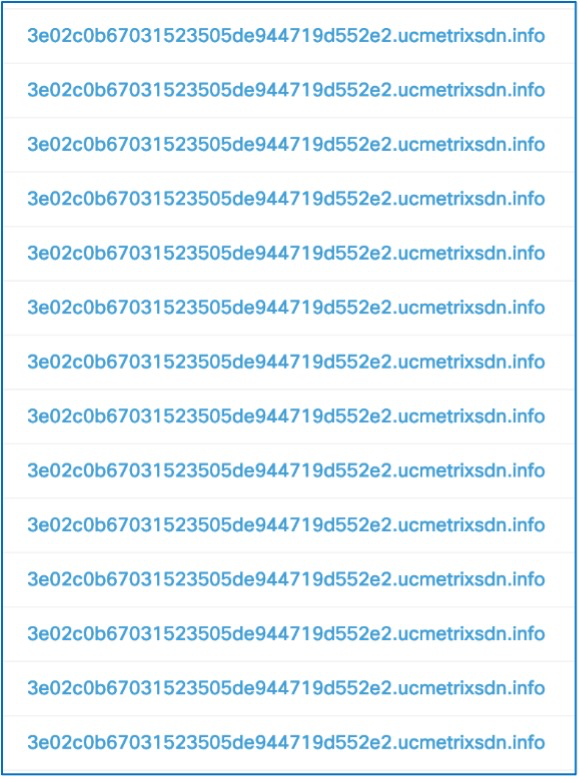
DGA is a technique in command and control (C&C) infrastructure that generally serves one of two purposes: to retrieve instructions from the malware's authors or administrators, or to exfiltrate data from the infected endpoint through covert channels. Because this malware is well-known (first detected in 2018), we can use public intelligence to compile expected behaviors and additional indicators of compromise to begin our investigation.
The DGA behavior here is well-known and attributed to the CoinLoader malware. Dark Trace has a detailed write-up that provided us some direction: https://darktrace.com/blog/catching-coinloader-decrypting-the-malware-hijacking-networks-for-cryptomining-operations. The questions we were immediately looking to answer were:
CoinLoader is an initial dropper designed to pull down other malicious payloads including ransomware, information stealers, and cryptominers. It seemed that this particular infection was likely at its initial stage, and Umbrella was successfully preventing further stages of infection by blocking the C&C traffic. There was no traffic logged between this device and other attendee IP addresses, nor any scanning activity so the risk to other attendees was presumed to be low.
The CoinLoader malware finds its victims by masquerading as cracked or pirated versions of legitimate software. To determine if the malware was downloaded on the conference network, we searched our SOC tools (including Secure Malware Analytics and Firewall file events) for instances of the file extensions RAR and ZIP, and any instances of filenames containing the strings "keygen" or "crack." We found no evidence that the malware was downloaded while on the conference network. Because we do not decrypt attendee traffic, this is impossible to know for sure.
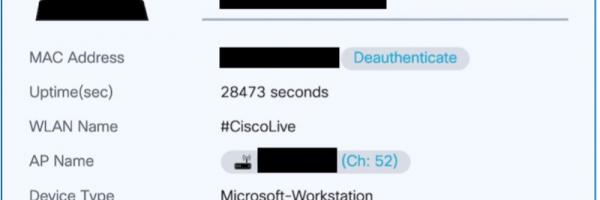
To find and notify the owner of the device, we used standard fingerprinting techniques. DHCP logs and traffic patterns are valuable for determining the OS and device type. In this case, MDNS queries emanating from the device gave away both the operating system type and the hostname. The hostname contained the first name of the attendee. Using data from the wireless infrastructure, we were able to physically locate the device on the show floor.
With the user notified and the device triaged, we turned to further hunting of related IOCs elsewhere on the network. We had a few things to look for including:
Using Splunk, we were able to efficiently search all our log sources for these IOCs and found no other instances of this infection.
Christian Clasen
Real world deployments often fall short of the idealistic architectures intended by vendors. Events, budgetary and time constraints, and technical feasibility often conspire to prevent the maximalist approach to security infrastructure. When inevitably faced with these challenges, analysts must rely on correlation techniques to make the most of the information available in the SOC environment. One such limitation we faced in the Cisco Live SOC was the lack of Umbrella Virtual Appliance (VA) integration leading to a blind spot in our client-side IP visibility. With a bit of knowledge of the mechanics of Umbrella operation, analysts were able to attribute malicious or suspicious DNS queries to client IP addresses on the public Wi-Fi despite the lack of VAs.
Umbrella is a recursive DNS resolver that utilizes the power of the global DNS to enforce security and acceptable use activity. The public IP addresses in use by the conference are registered to an Umbrella organization so that DNS queries can be attributed and handled by the right policies. Because of NAT, any IPv4 queries will be attributed to the public address servicing all attendees. In an optimal Umbrella deployment, internal recursive resolver would be installed (VAs) and these would provide internal IPv4 attribution. Unfortunately, the internal resolvers used at the conference did not provide this functionality, and so Umbrella alerts only provided public IP address attribution.
The obvious solution to this would be to ingest the internal recursive resolver logs into our SIEM and SOAR infrastructure. This was planned and being actively worked on, but not immediately available in the earliest parts of the conference. So how to bridge this gap and ensure the most specific information is available for these events? The answer is simple if you know how Umbrella works.
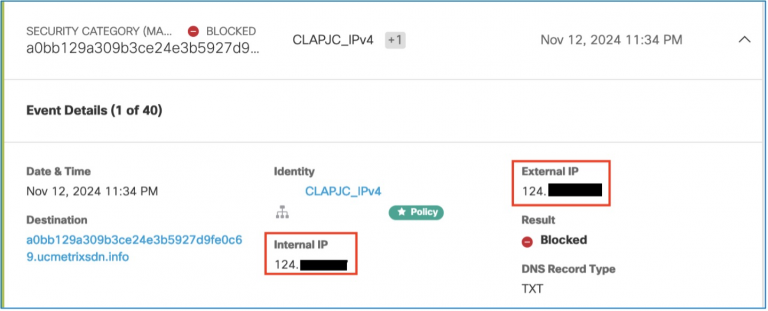
When Umbrella determines that a query is for a malicious domain, it doesn't simply refuse the resolution or return an NXDOMAIN response. It instead resolves to dedicated IP addresses owned by Cisco, and then waits for the subsequent connection so that it can return a block page. For HTTP/S connections, this is the best way to communicate to the end user why their connection failed. Umbrella reserves specific IP addresses for domain categories such as Malware, Phishing, and Command and Control traffic: https://docs.umbrella.com/deployment-umbrella/docs/block-page-ip-addresses.
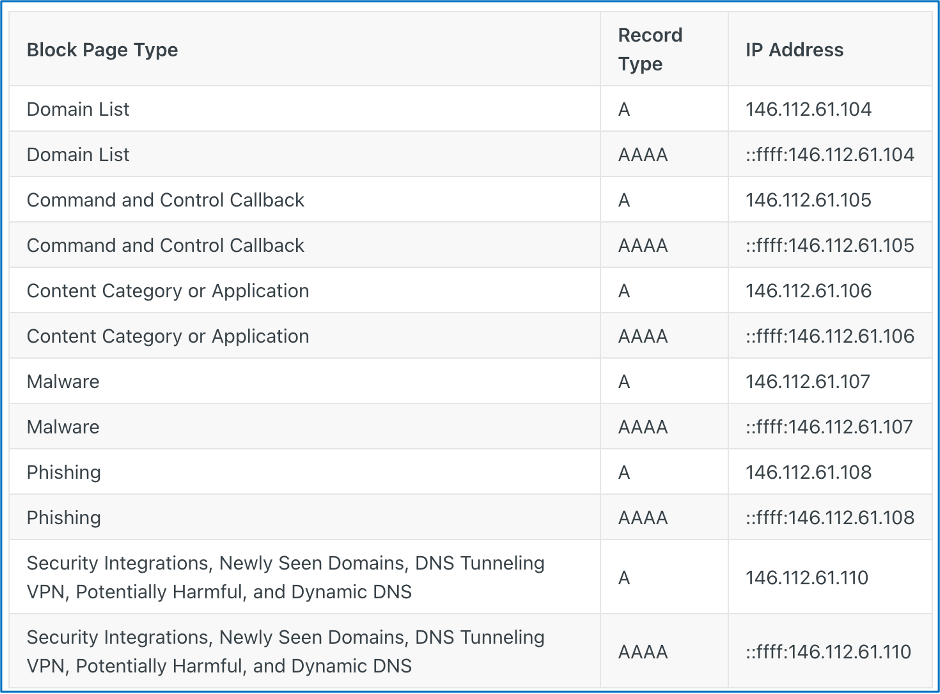
Armed with this information, there are two strategies for correlating the Umbrella DNS events with Firewall events. By filtering the Firewall connections for the destination IP address associated with Umbrella Malware blocks (146.112.61[.]107) we can find any connections the client subsequently made after resolving the malicious domain. If the connection is attempted over HTTP or HTTPS, we can very likely see the hostname in the HOST header or Server Name Indication (SNI) extension field. This is because the client still thinks it is connecting to the intended malware server, and not Umbrella.

For non-web traffic we can simply correlate the timestamp in the Umbrella event with the IP connection in the firewall events to determine with confidence that the specific internal client IP was the source of the malicious or suspicious DNS query. From there, geolocation information from the wireless infrastructure can help us track down devices and individuals when the content of the alert warrants it.
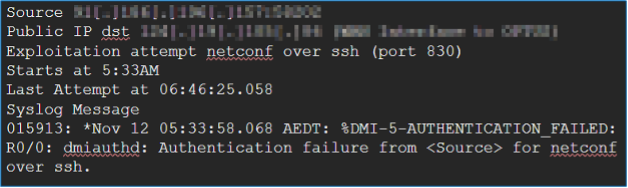
Aditya Raghavan, Adam Kilgore
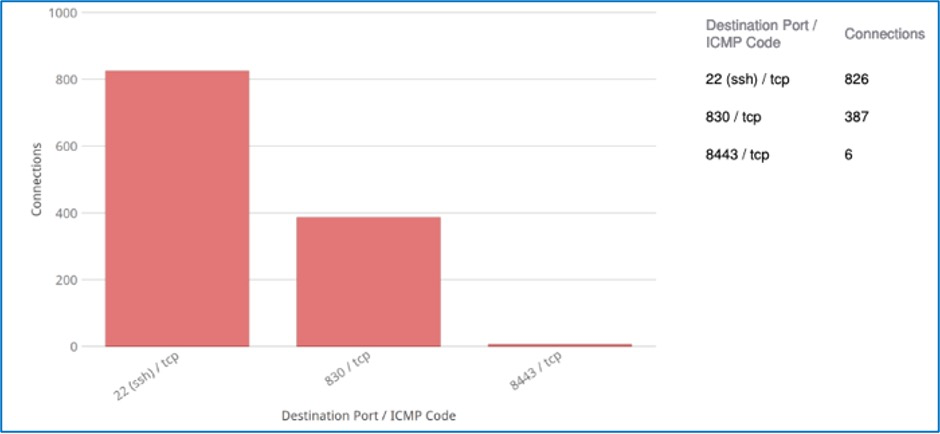
It all started with Adam seeing a bunch of SSH connections from an IP in the DC static host group range to some internal IPs on a non-standard port (TCP 830). Prima facie, all those connections were successful, so it appeared legitimate.
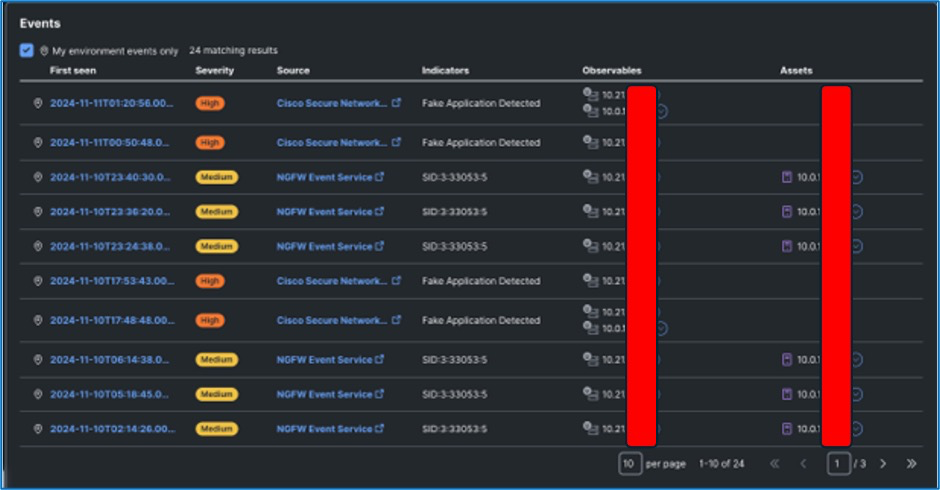
We investigated the source and destination entities in XDR Investigate and it found another neighboring device from the Infra Management host group also involved in similar traffic patterns. Additionally, the traffic between the devices in Infra Management and DC Static host groups triggered a bunch of Snort signatures on the firewall.
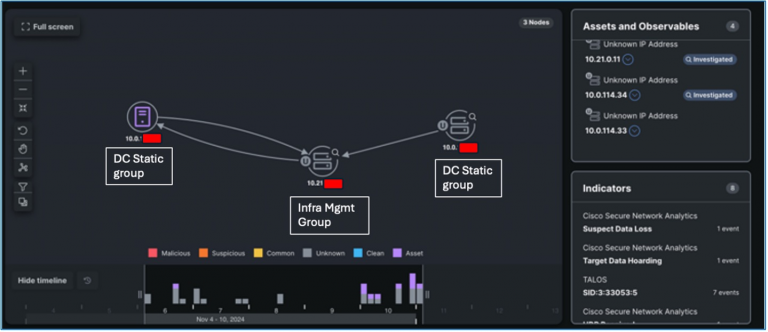
Secure Network Analytics validated the traffic patterns with Fake Application Detected events. This was then escalated to the NOC team as the Infra Management segment was under their ownership.
Freddy Bello, the NOC lead, investigated it and identified the entities as Wireless LAN controller (in Infra Management) and DNA Spaces Controllers (in DC Static). And the traffic pattern involving SSH on a non-standard port was an app on the controller poking them to extract telemetry regarding the status of the access points on the show floor.
While the traffic turned out to be expected, this is a good example of SOC workflows to investigate traffic patterns that appear abnormal or could be a sign of compromise or malicious activity if they are not confirmed to be from a legitimate source. By keeping a close working relationship with the NOC, we are able to provide insights into traffic patterns and behaviors and receive back confirmation of whether an investigation should be escalated or whether it can be safely closed. All in all, this turned out to be a Cisco Live Positive. On to find the next needle in the haystack, folks.
Zoltan Karczag, Cam Dunn, Christian Clasen
The SOC received notification from the NOC of some activity that was seen by them on their WAN router:
This activity was dropped by an ACL on the WAN router and never made it to the firewall, so was not seen by the SOC.
 Tags quentes :
Cisco Live Melbourne
threat hunting
Security Operations Center SOC
XDR
Tags quentes :
Cisco Live Melbourne
threat hunting
Security Operations Center SOC
XDR
Cadastre-se agora para Ações Semanais de Promoção
100% free, Unsubscribe any time!
Add 1: Room 605 6/F FA YUEN Commercial Building, 75-77 FA YUEN Street, Mongkok KL, HongKong Add 2: Room 405, Building E, MeiDu Building, Gong Shu District, Hangzhou City, Zhejiang Province, China
Whatsapp/Tel: +8618057156223 Tel: 0086 571 86729517 Tel em HK: 00852 66181601
Email: [email protected]
 English
 Pусский
 Français
 Español
 Português