Cadastre-se agora para um orçamento mais personalizado!


Cisco is honored to be a partner of the Black Hat NOC (Network Operations Center), as the Official Security Cloud Provider. This was our 9th year supporting Black Hat Asia.
We work with other official providers to bring the hardware, software and engineers to build and secure the Black Hat network:Arista, Corelight, MyRepublic and Palo Alto Networks.
The primary mission in the NOC is network resilience. The partners also provide integrated security, visibility and automation, a SOC (Security Operations Center) inside the NOC.
 Fig. 1: Presenting the Black Hat Asia Dashboards
On screens outside the NOC, partner dashboards gave attendees a chance to view the volume and security of the network traffic.
 Fig. 2:Black Hat dashboards on display outside of the NOC
Cisco joined the Black Hat NOC in 2016, as a partner to provide automated malware analysis with Threat Grid. The Cisco contributions to the network and security operations evolved, with the needs of the Black Hat conference, to include more components of the Cisco Security Cloud.
Cisco Breach Protection Suite
Cisco User Protection Suite
Cisco Cloud Protection Suite
When the partners deploy to each conference, we set up a world-class network and security operations center in three days. Our primary mission is network uptime, with better integrated visibility and automation. Black Hat has the pick of the security industry tools and no company can sponsor/buy their way into the NOC. It is invitation only, with the intention of diversity in partners, and an expectation of full collaboration.
As a NOC team comprised of many technologies and companies, we are continuously innovating and integrating, to provide an overall SOC cybersecurity architecture solution.
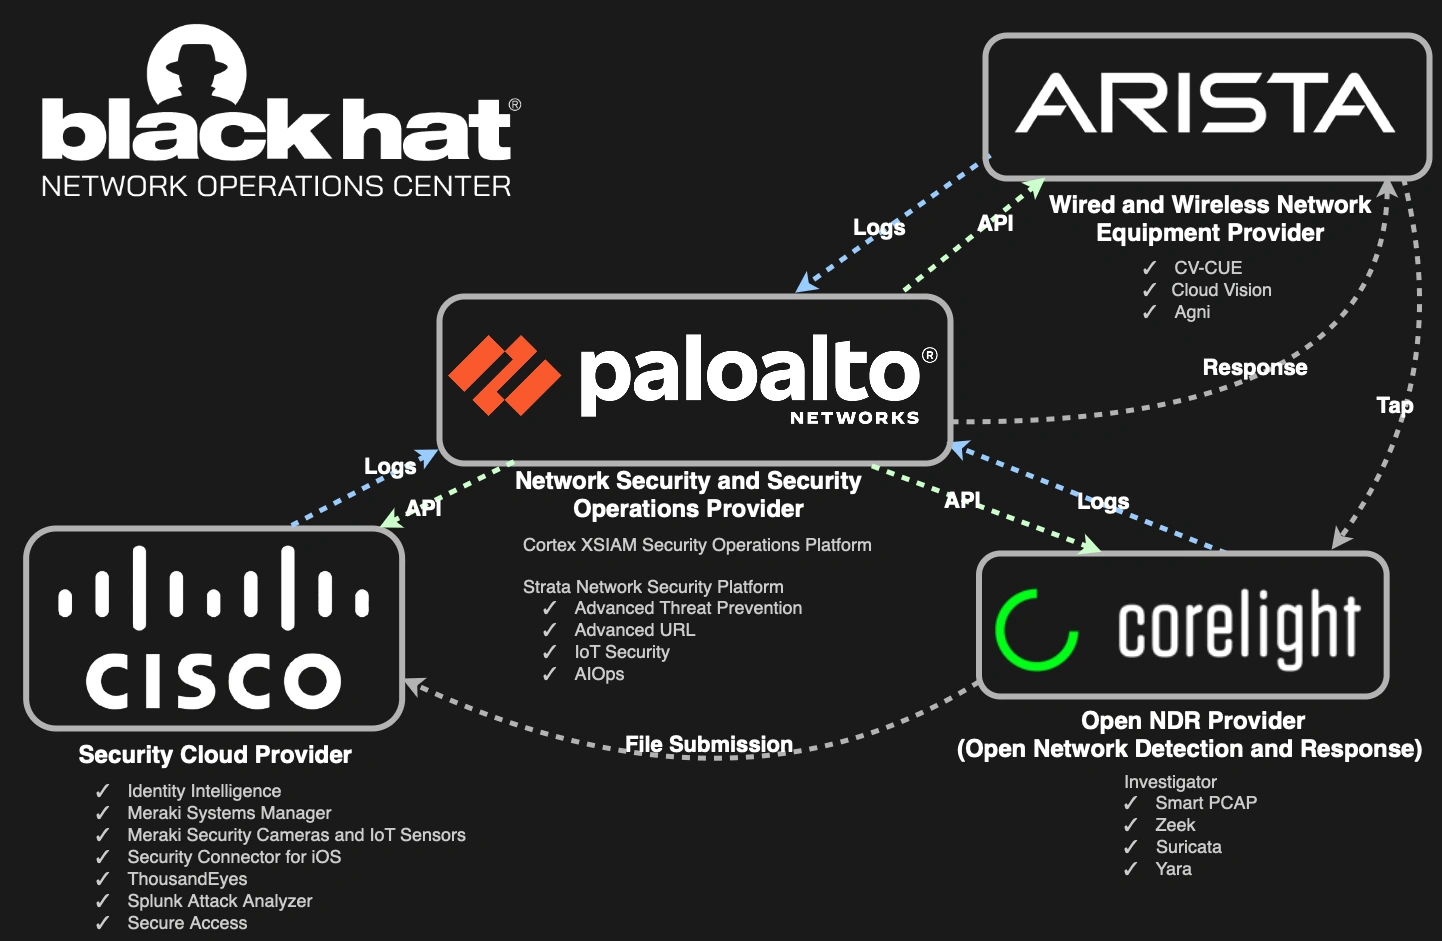 Fig. 3Diagram showing different companies and solutions present in the NOC
The integration with Corelight NDR and both Secure Malware Analytics and Splunk Attack Analyzer is a core SOC function. At each conference, we see plain text data on the network. For example, a training student accessed a Synology NAS over the internet to access SMB shares, as observed by Corelight NDR. The document was downloaded in plain text and contained API keys & cloud infrastructure links. This was highlighted in the NOC Report as an example of how to employ better security posture.
 Fig. 4:Exported report from Secure Malware Analytics
As the malware analysis provider, we also deployed Splunk Attack Analyzer as the engine of engines, with files from Corelight and integrated it with Splunk Enterprise Security.
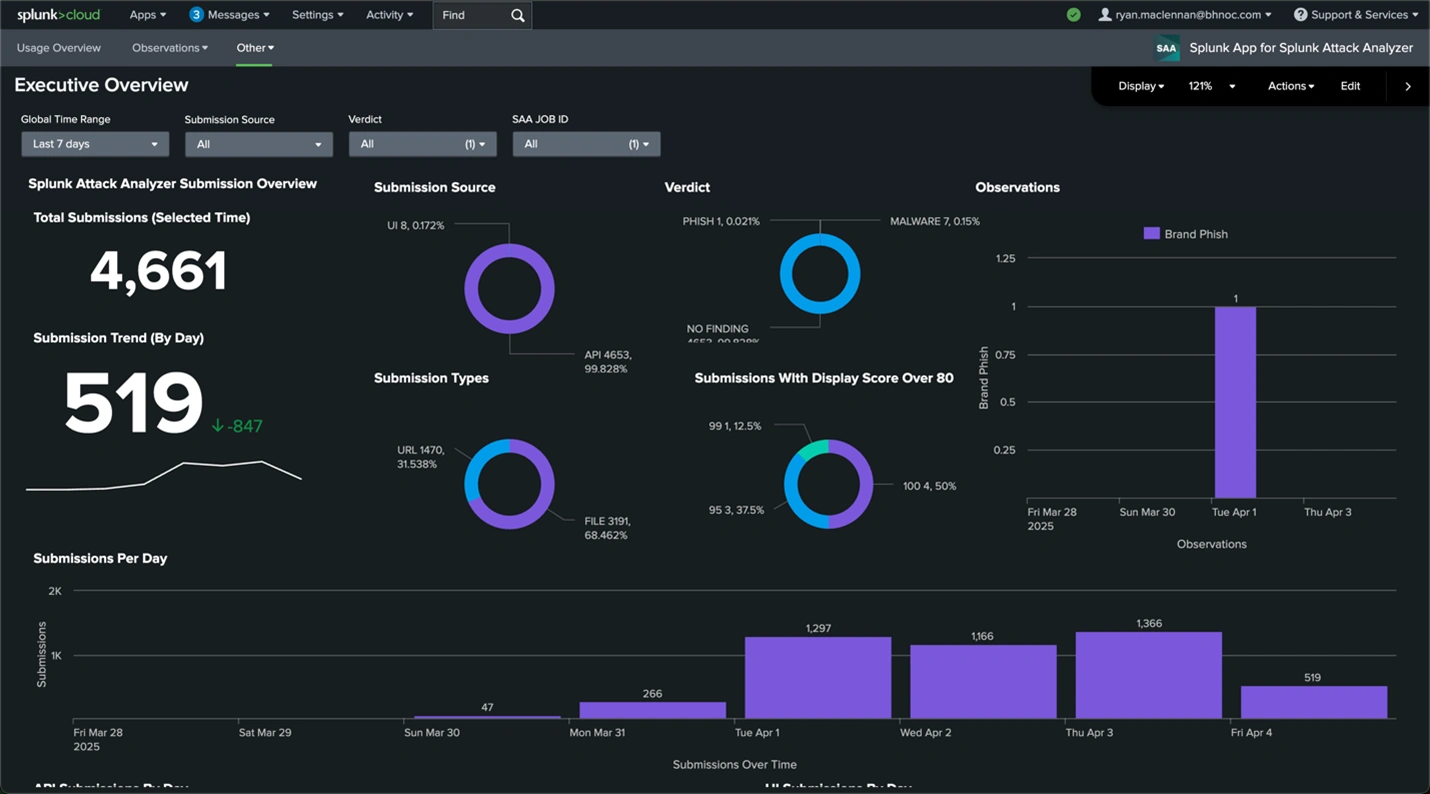 Fig. 5: Splunk Cloud Executive Order dashboard
The NOC leaders allowed Cisco (and the other NOC partners) to bring in additional software and hardware to make our internal work more efficient and have greater visibility. However, Cisco is not the official provider for Extended Detection & Response (XDR), Security Event and Incident Management (SEIM), Firewall, Network Detection & Response (NDR)orCollaboration.
Breach Protection Suite
Splunk Cloud Platform: Integrations and dashboards
Cisco Webex: Incident notification and team collaboration
In addition, we deployed proof of value tenants for security:
The Cisco XDR Command Center dashboard tiles made it easy to see the status of each of the connected Cisco Security technologies.
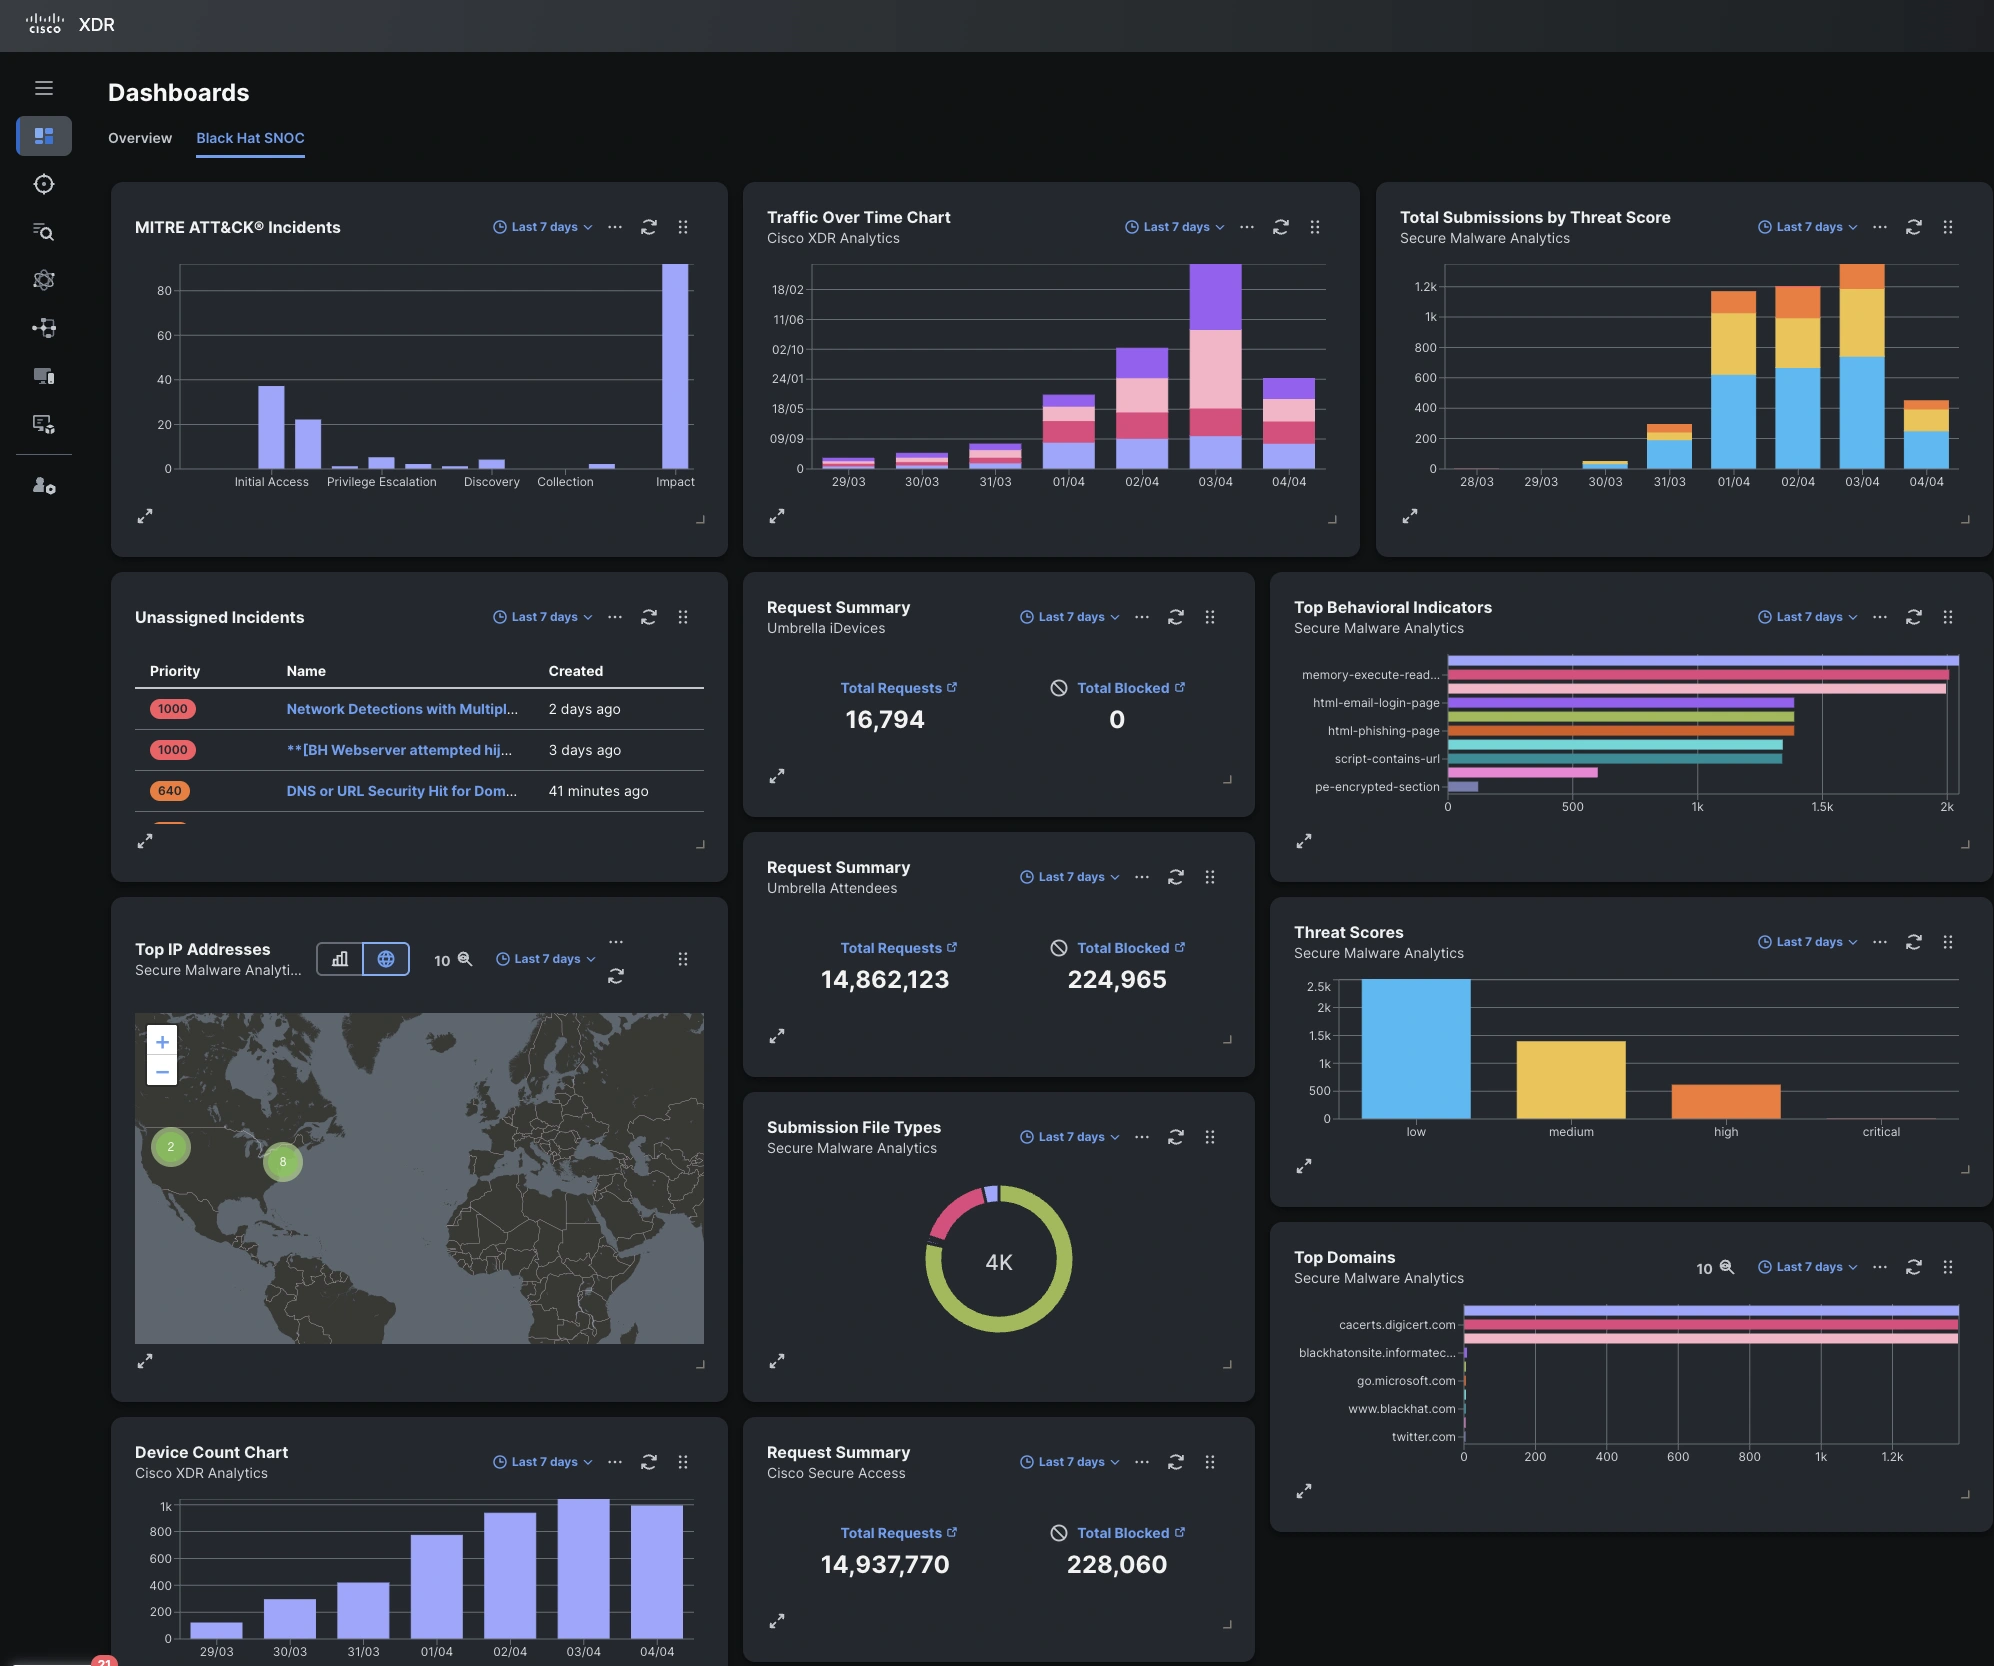 Fig. 6: Cisco XDR dashboard tiles at Black Hat Asia 2025
Below are the Cisco XDR integrations for Black Hat Asia, empowering analysts to investigate Indicators of Compromise (IOC) very quickly, with one search.
We appreciate alphaMountain.ai and Pulsedive donating full licenses to Cisco, for use in the Black Hat Asia 2025 NOC.
| Splunk Cloud Platform | Third Party |
|---|---|
| Splunk Cloud Platform | alphaMountain.ai |
| Splunk Enterprise Security | AlienVault OTX |
| Secure Access | CyberCrime Tracker |
| Meraki System Manager | Google Safe Browsing |
| Secure Endpoint for iOS | Pulsedive |
| Secure Malware Analytics | Shodan |
| ThousandEyes (custom for BH) | Threatscore | Cyberprotect| Cyberprotect |
| Umbrella DNS | Slack |
| Webex | urlscan |
| XDR Analytics | |
| Cisco Telemetry Broker | |
| Secure DDoS and WAF, by Radware |
The view in the Cisco XDR integrations page:
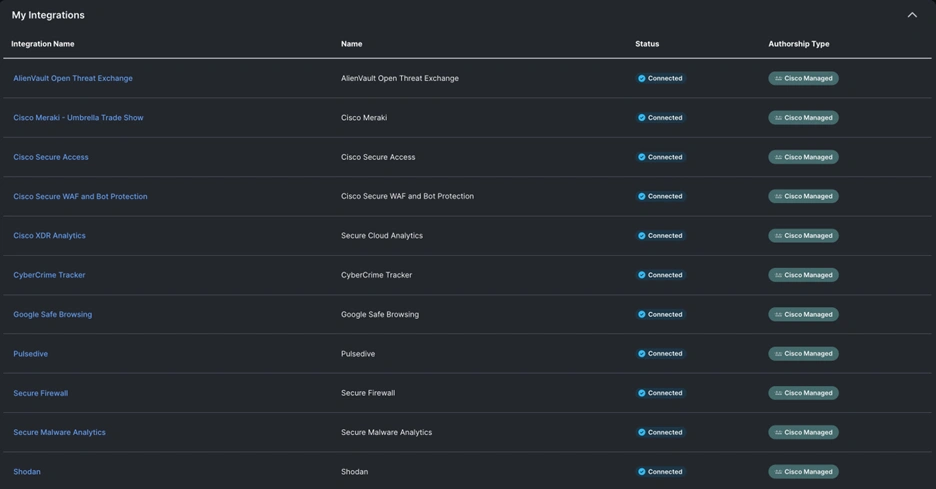 Fig. 7Cisco XDR integrations page for Black Hat Asia
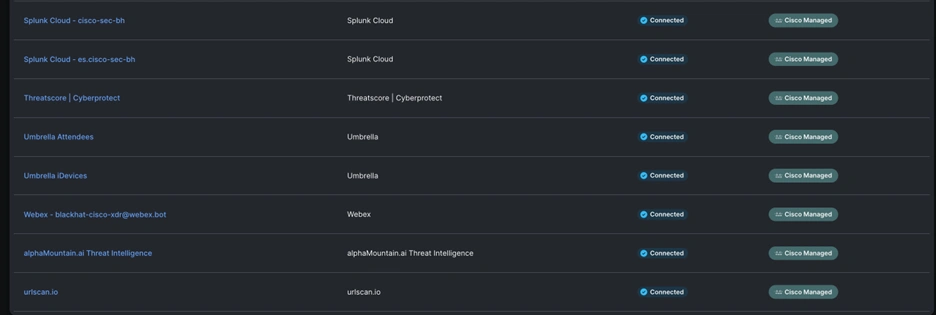 Fig. 8: Cisco XDR integrations page for Black Hat Asia
Authored by: Ivan Berlinson, Aditya Raghavan
As the technical landscape evolves, automation stands as a cornerstone in achieving XDR outcomes. It's a testament to the prowess of Cisco XDR that it boasts a fully integrated, robust automation engine.
Cisco XDR Automation embodies a user-friendly, no-to-low code platform with a drag-and-drop workflow editor. This innovative feature empowers your SOC to speed up its investigative and response capabilities. You can tap into this potential by importing workflows within the XDR Automate Exchange from Cisco, or by flexing your creative muscles and crafting your own.
Remember from our past Black Hat blogs, we used automation for creating incidents in Cisco XDR from Palo Alto Networks and Corelight.
The following automation workflows were built specifically for Black Hat use cases:
Category: Create or update an XDR incident
Category: Notify/Collaborate/Reporting
Category: Investigate
Category: Report
Category: Correlation
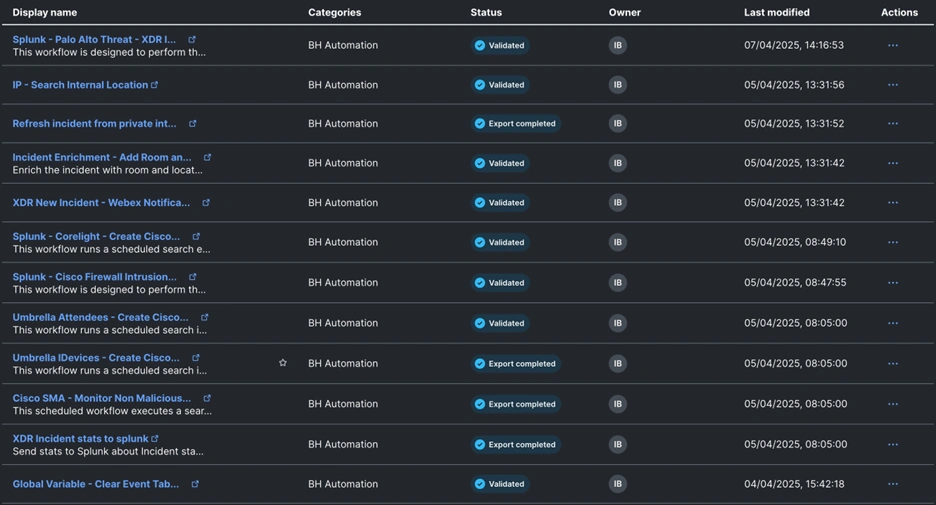 Fig. 9: Black Hat automations screen
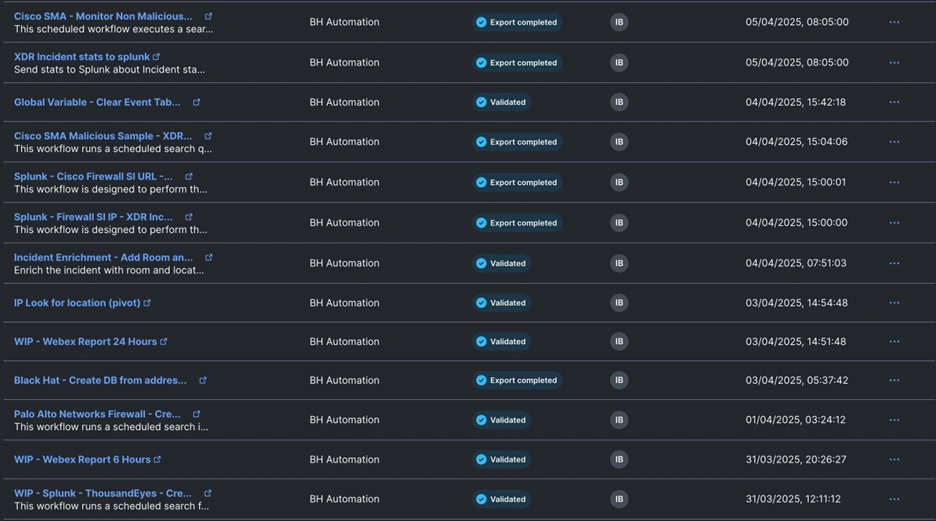 Fig. 10: Black Hat automations screen
Via Splunk Search API: Create or Update XDR Incident
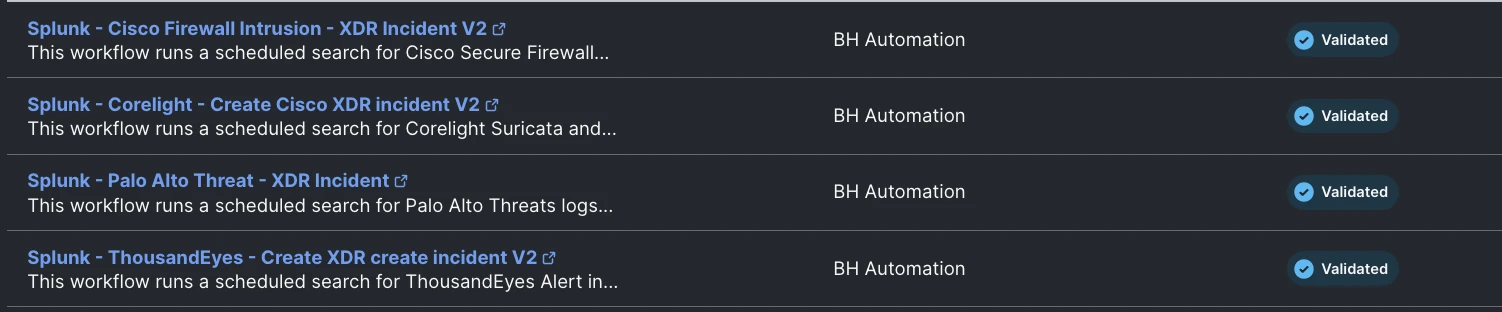 Fig. 11: Workflows for XDR incident creation from Splunk
These workflows are designed to run every five minutes and search the Splunk Cloud instance for new logs matching certain predefined criteria. If new logs are found since the last run, the following actions are performed for each of them:
 Fig. 12: Incident sample created by the workflow
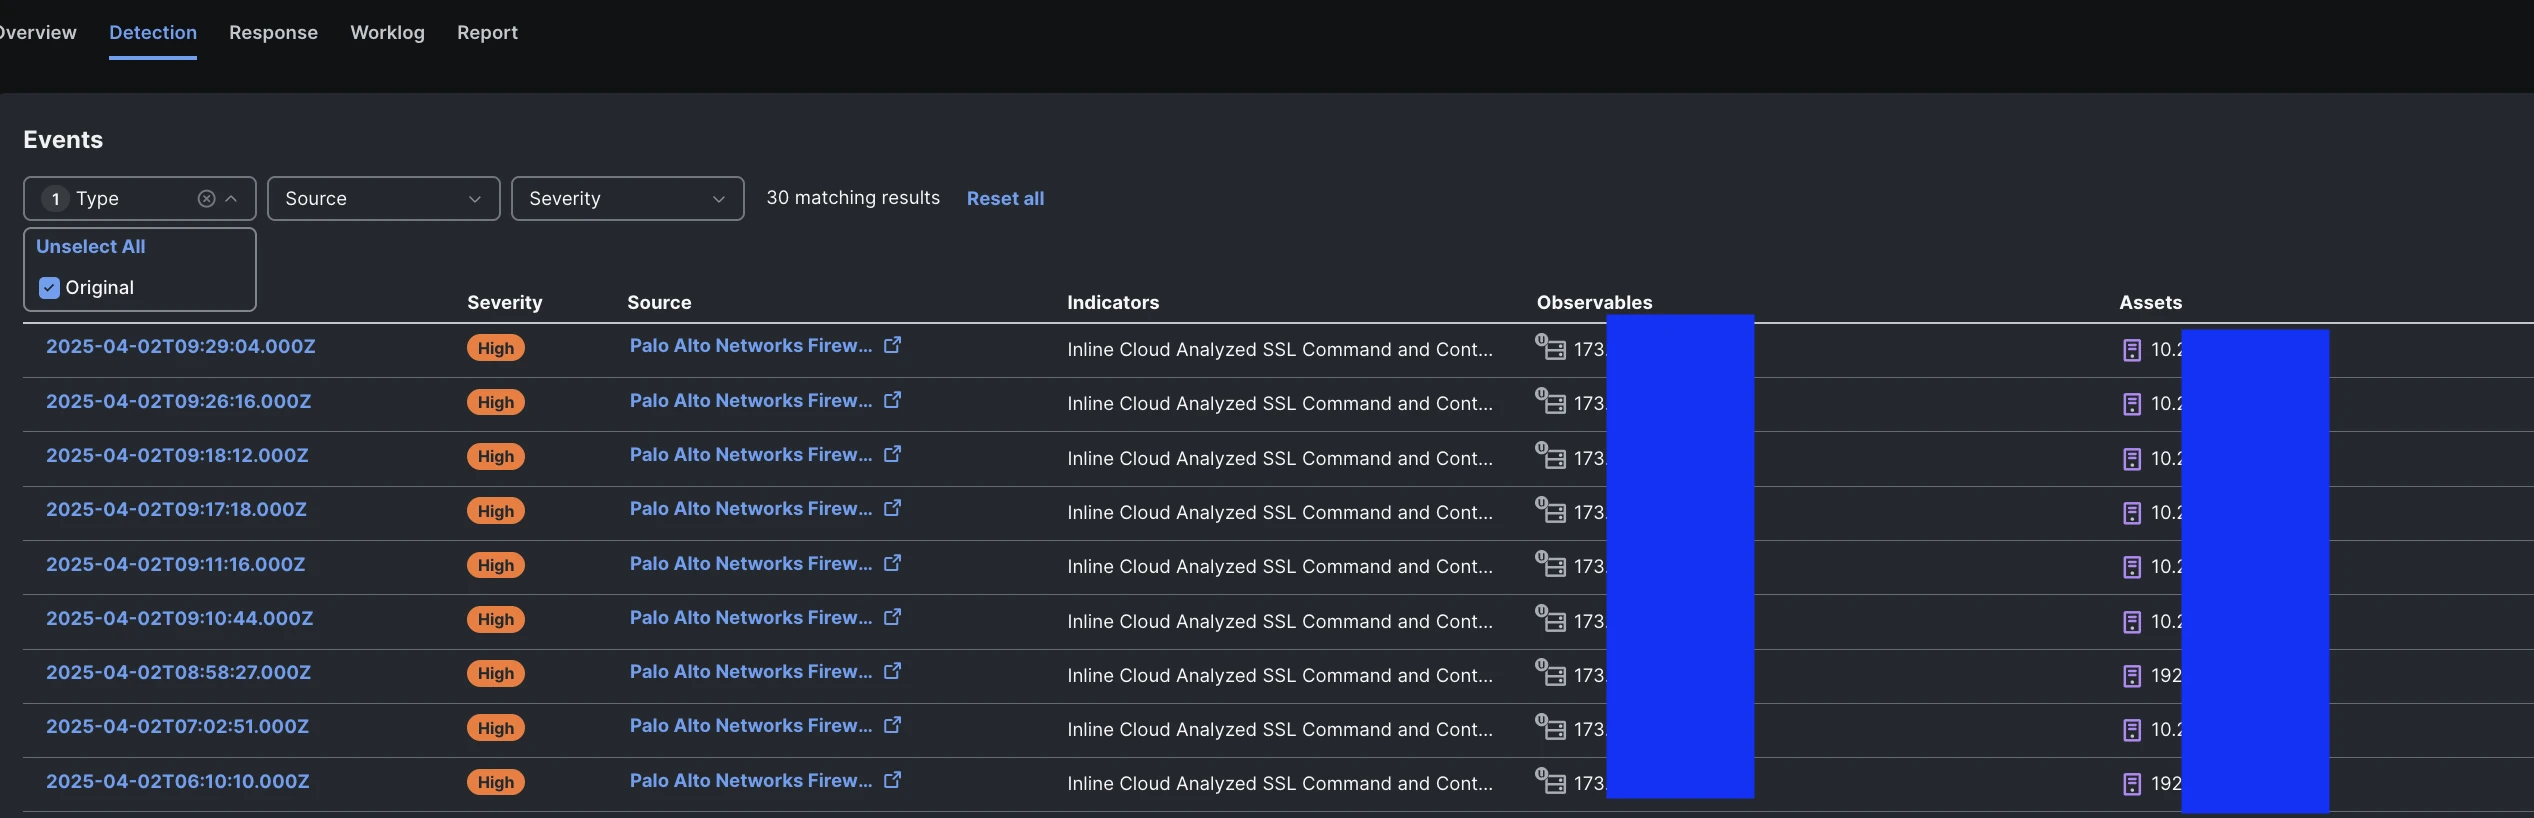 Fig. 13: Sightings/Detections part of the incident
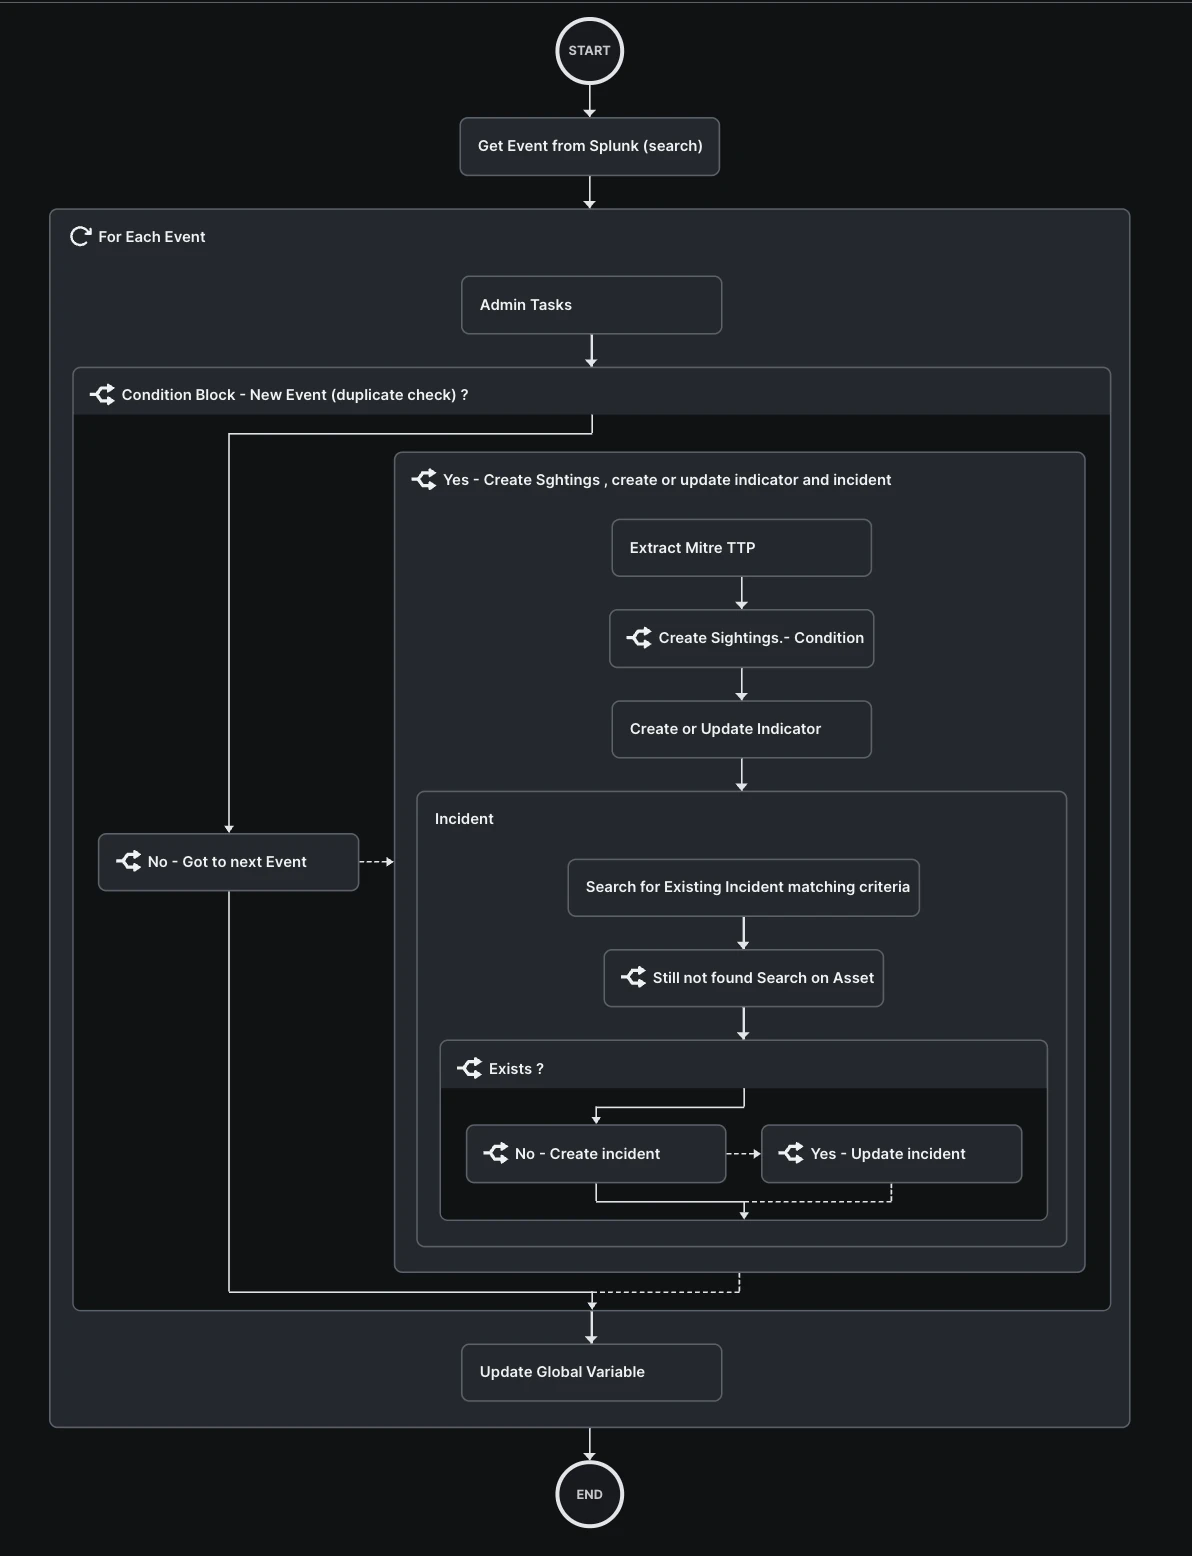 Fig. 14: Workflow: Create XDR Incident from Splunk, high level view
It was important for the analysts to obtain as much information as possible to help them understand whether the malicious behavior detected as part of an incident was a true security incident with an impact on the event (a True Positive), or whether it was legitimate in the context of a Black Hat demo, lab and training (a Black Hat Positive).
One of the methods we used was a workflow to find out the location of the assets involved and the purpose of it. The workflow is designed to run:
The workflow uses one or more IP addresses as input, and for each of them:
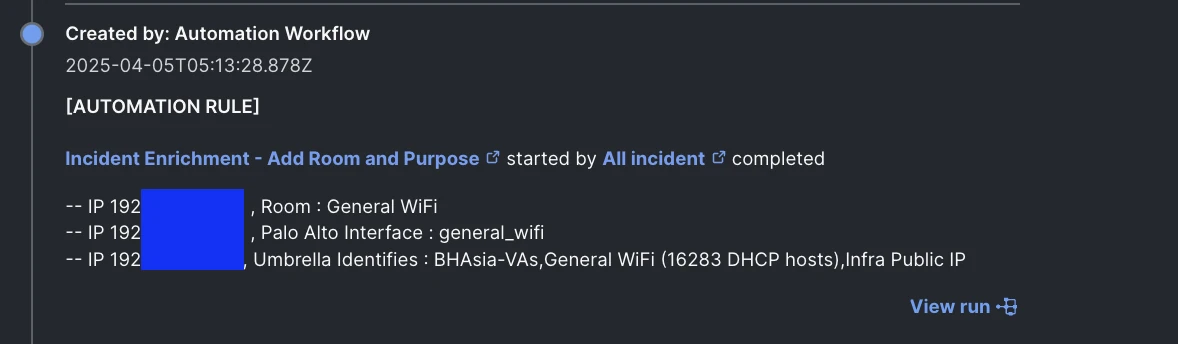 Fig. 15: Note added to the incident
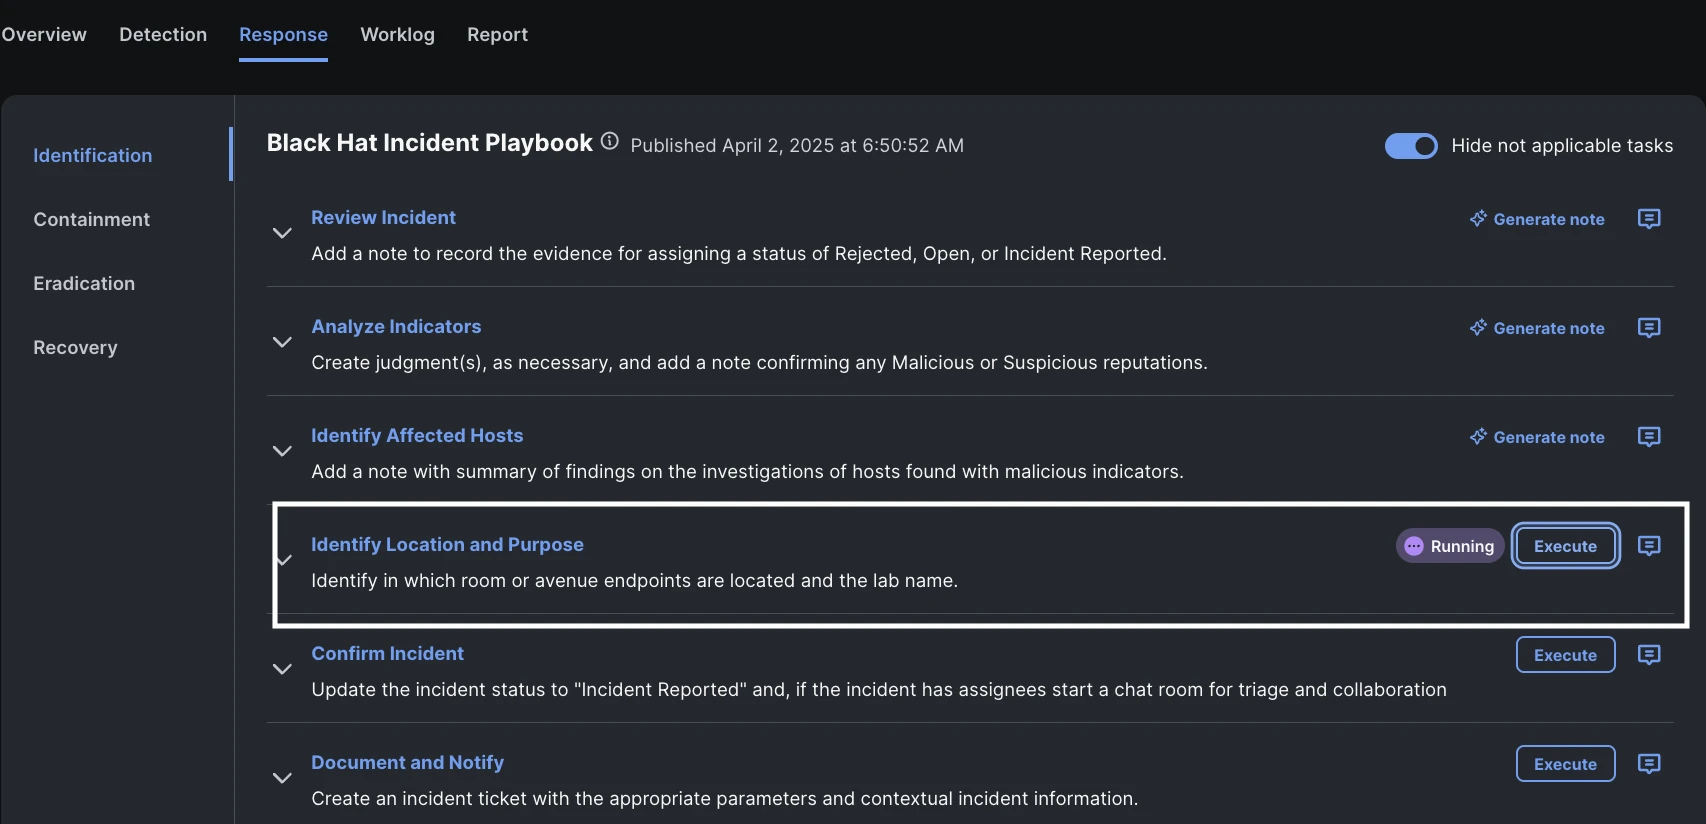 Fig. 16: Execution via Incident Playbook
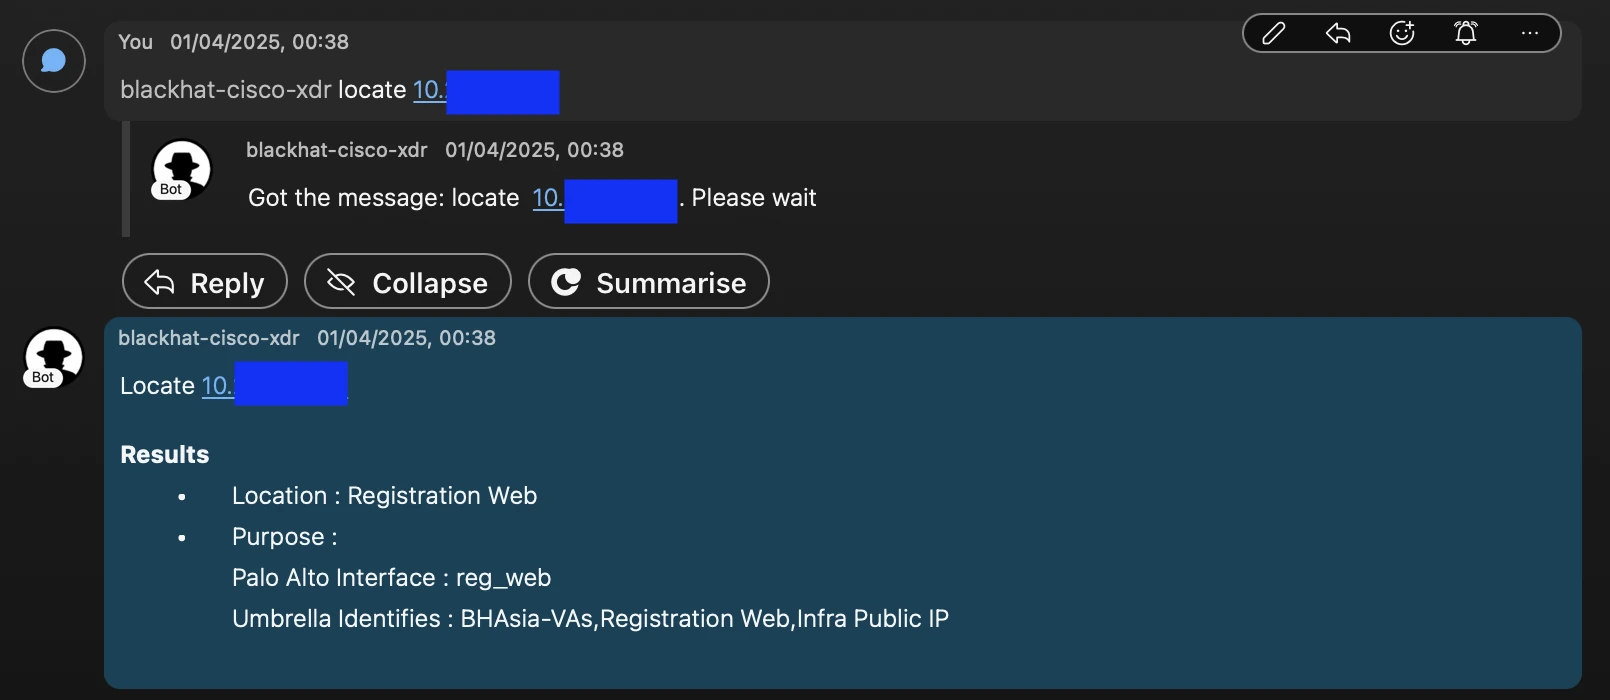 Fig. 17: Execution via the Cisco Webex Interactive Bot
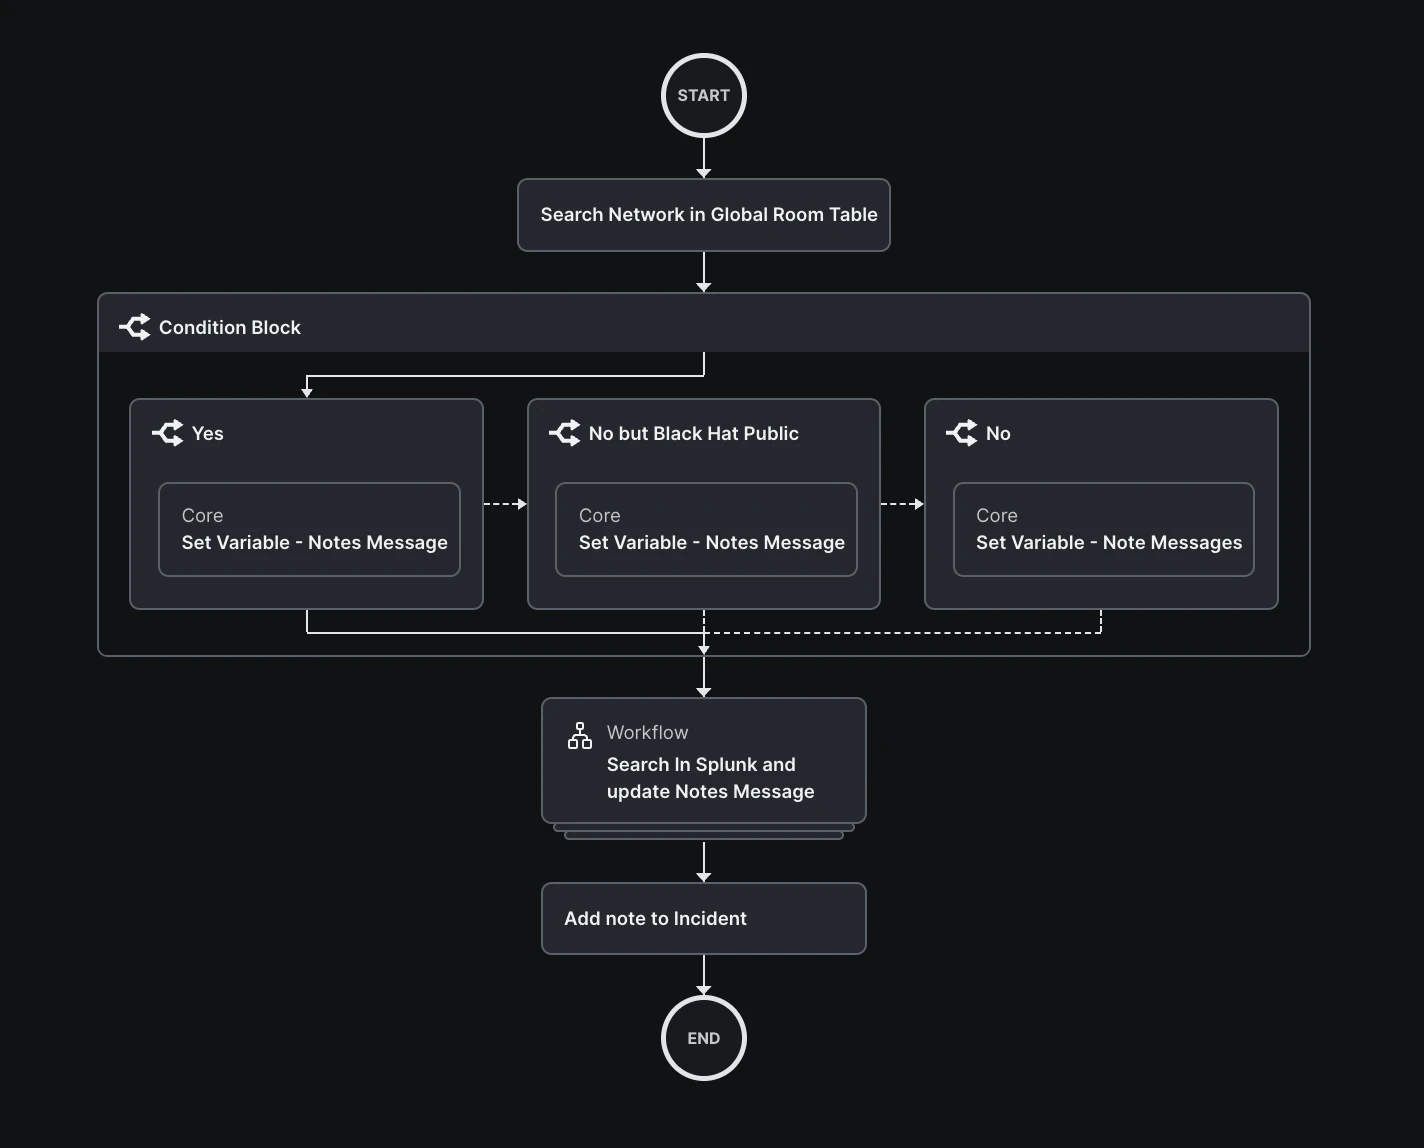 Fig. 18: High level overview of the workflow
Proper communication and notification are key to ensure no incident is ignored.
In addition to Slack, we were leveraging Cisco Webex to receive a notification when a new incident was raised in Cisco XDR and an interactive Bot to retrieve additional information and help in the first step of the investigation.
Notification
On new incident an automation was triggering a workflow to grab a summary of the incident, trigger the enrichment of the location and purpose of the room (see previous workflow) and send a Notification in our collaborative room with details about the incident and a direct link to it in XDR.
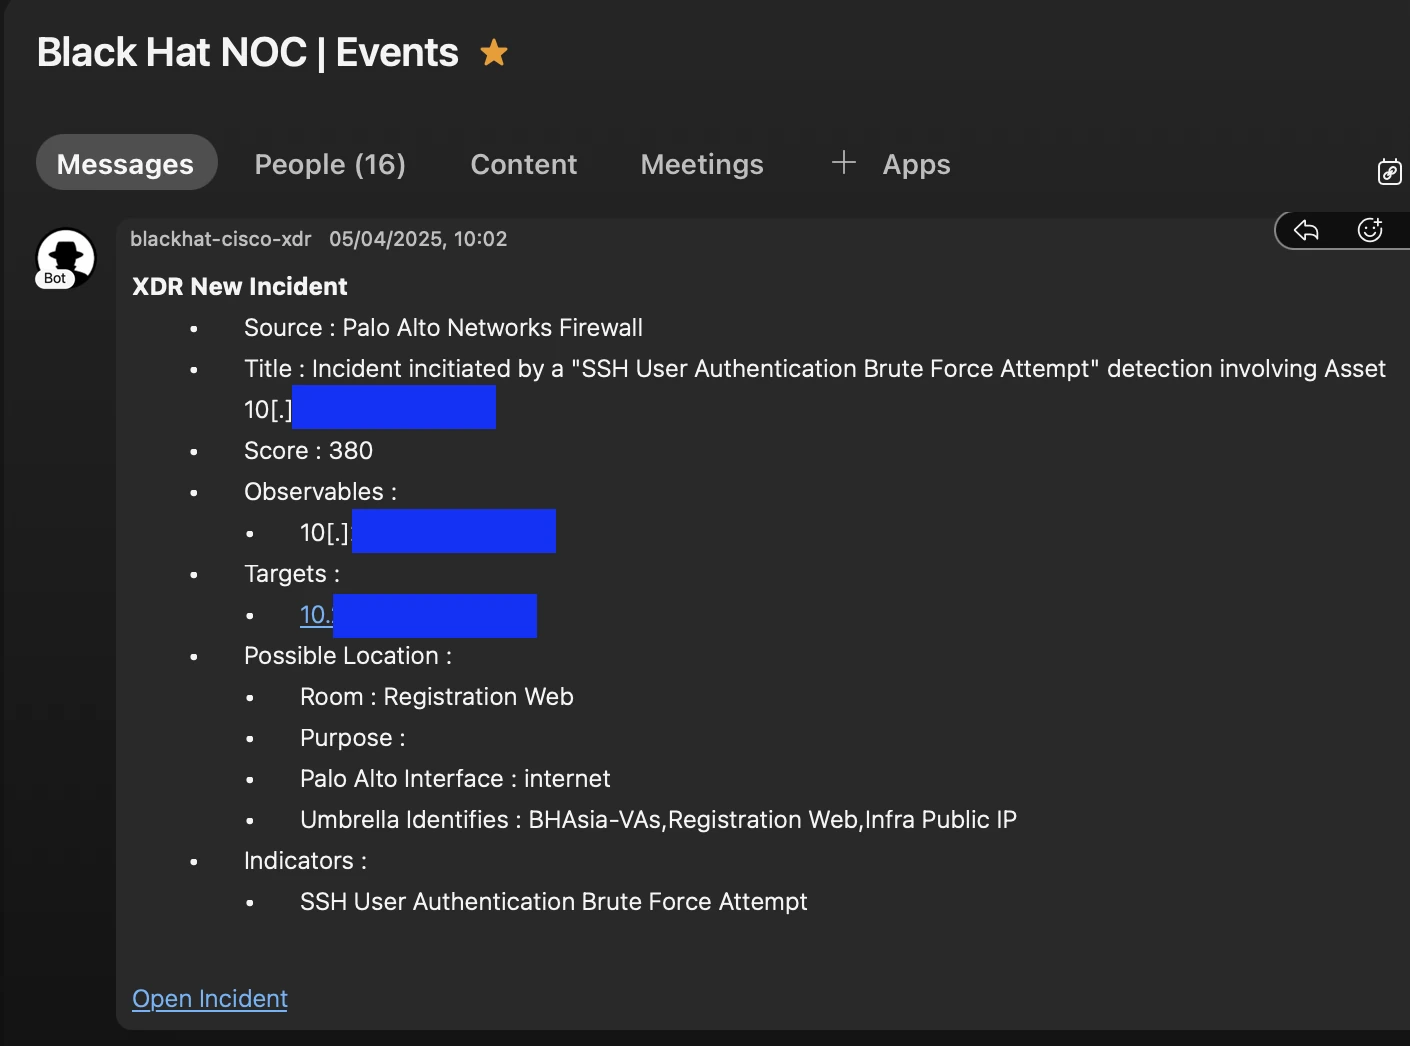 Fig. 19: Cisco Webex Notification on a new XDR Incident
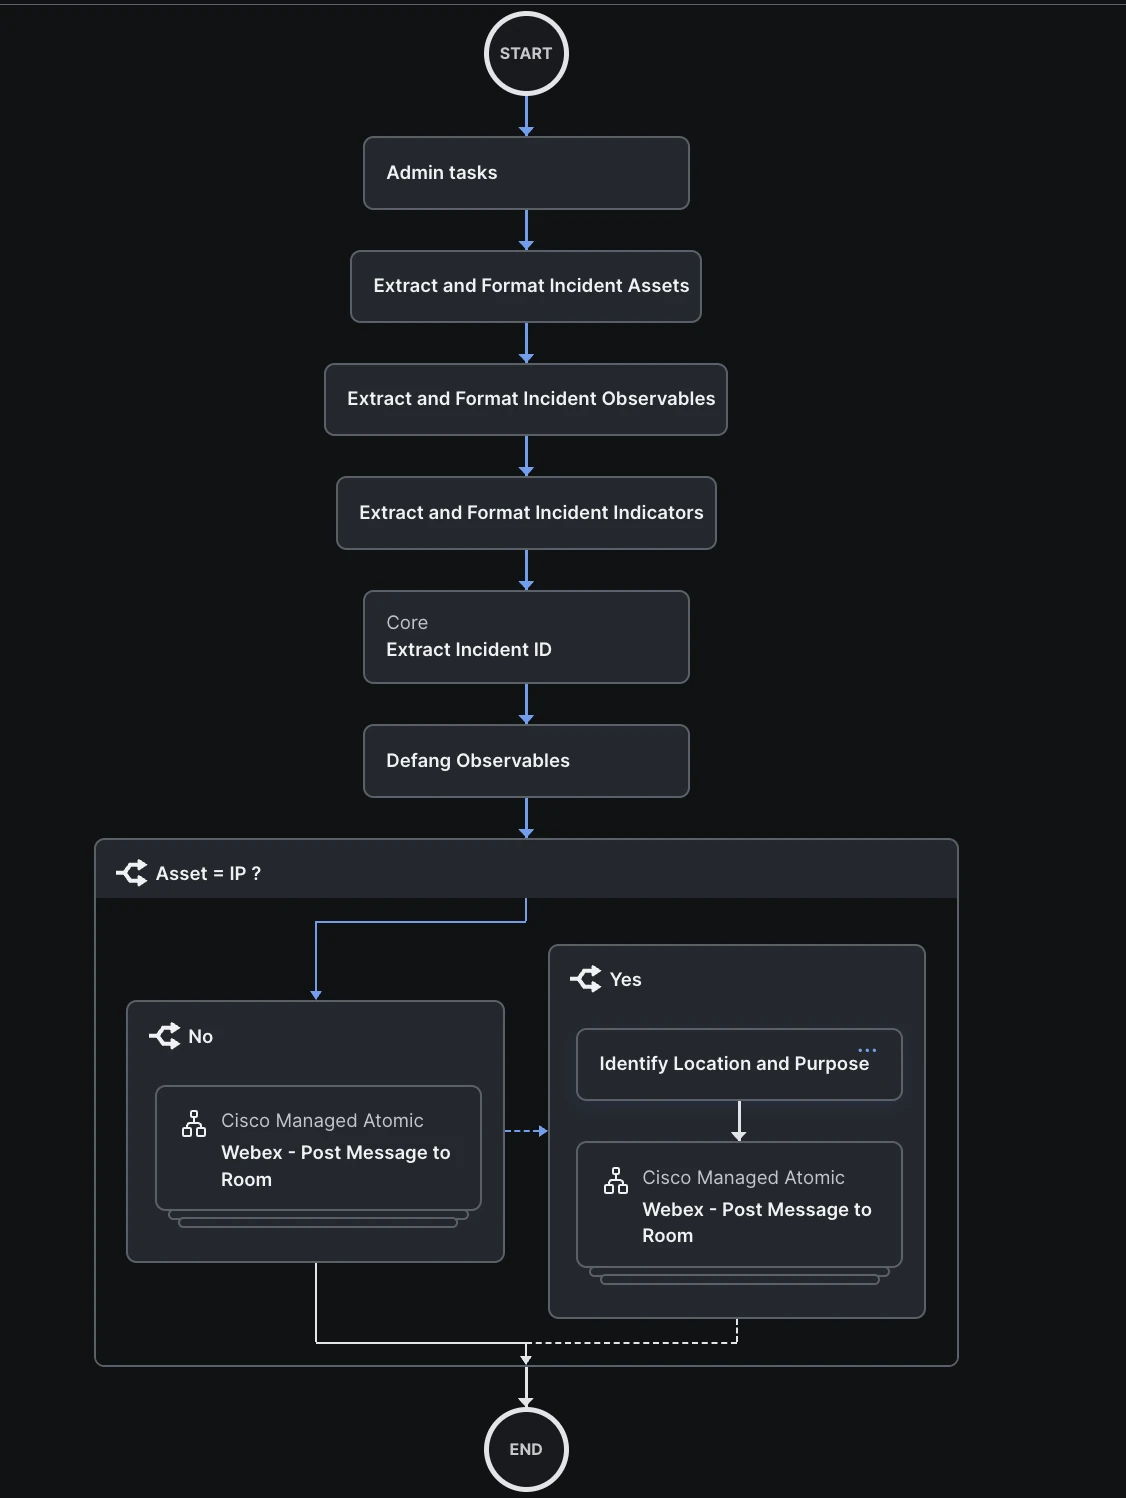 Fig. 20: High level view of workflow
Interactive Bot
An interactive Webex Bot tool was also used to help the analyst. Four commands were available to trigger a workflow in Cisco XDR via a Webhook and display the result as a message in Cisco Webex.
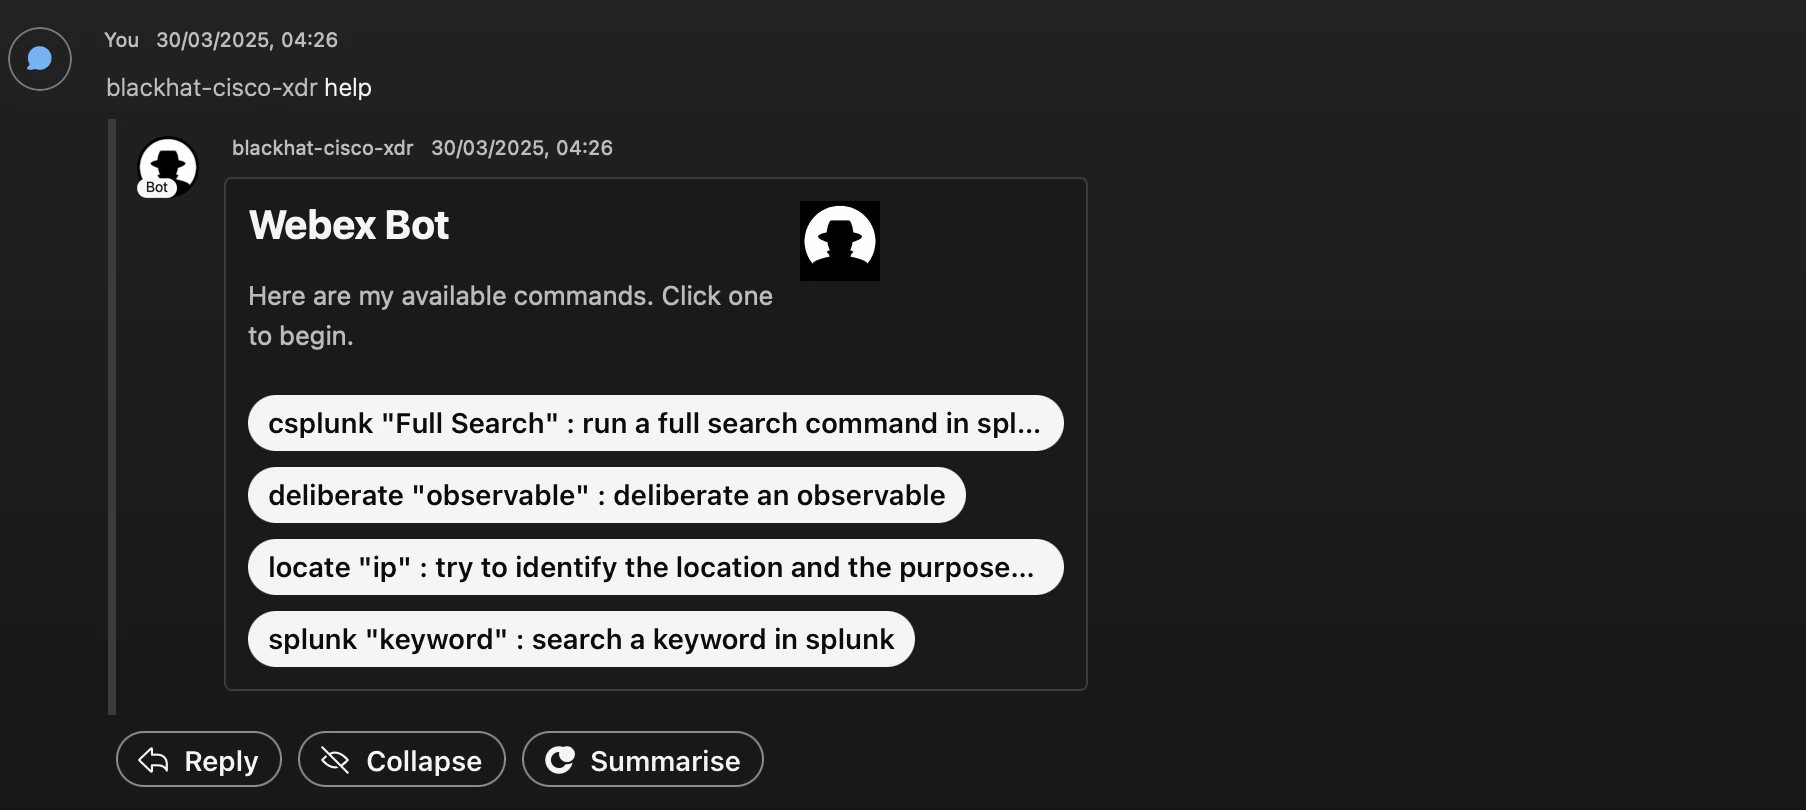 Fig. 21: Webex Bot, help options
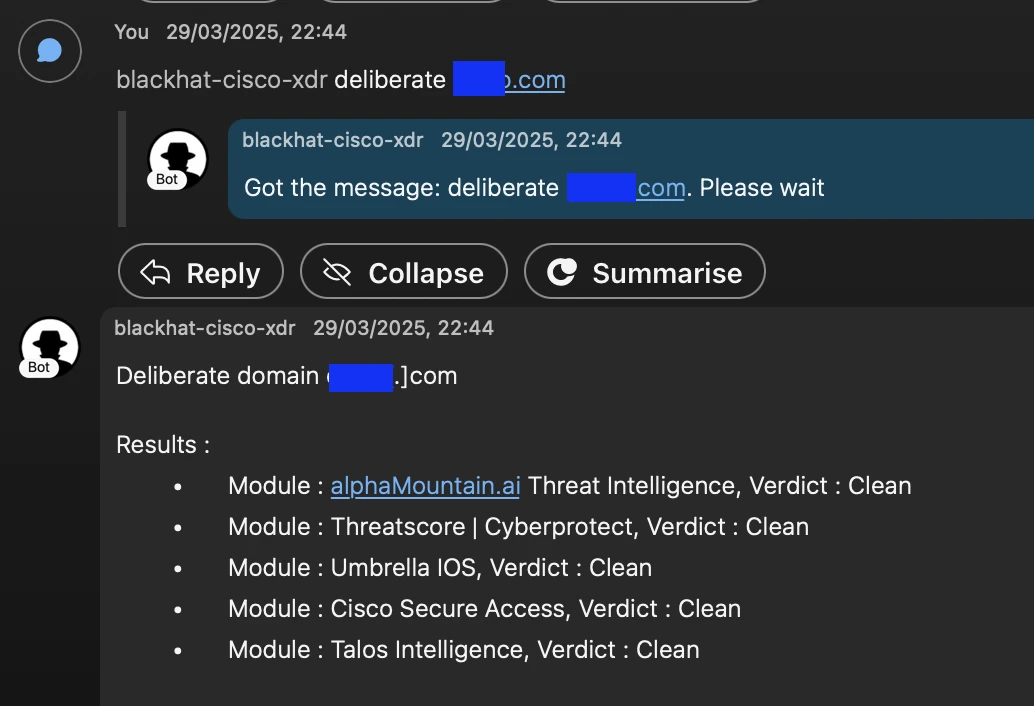 Fig. 22: Deliberate via the Webex Bot
 Fig. 23: Search Splunk via the Webex bot
Last 6/24 hours reports to Webex
Both workflows run every 6 hours and every 24 hours to generate and push to our Webex collaboration rooms a report including the Top 5 assets, domains and target IPs in the security event logs collected by Splunk from Palo Alto Networks Firewall, Corelight NDR and Cisco Umbrella (search [...] | stats count by [...]).| stats count by [...]).
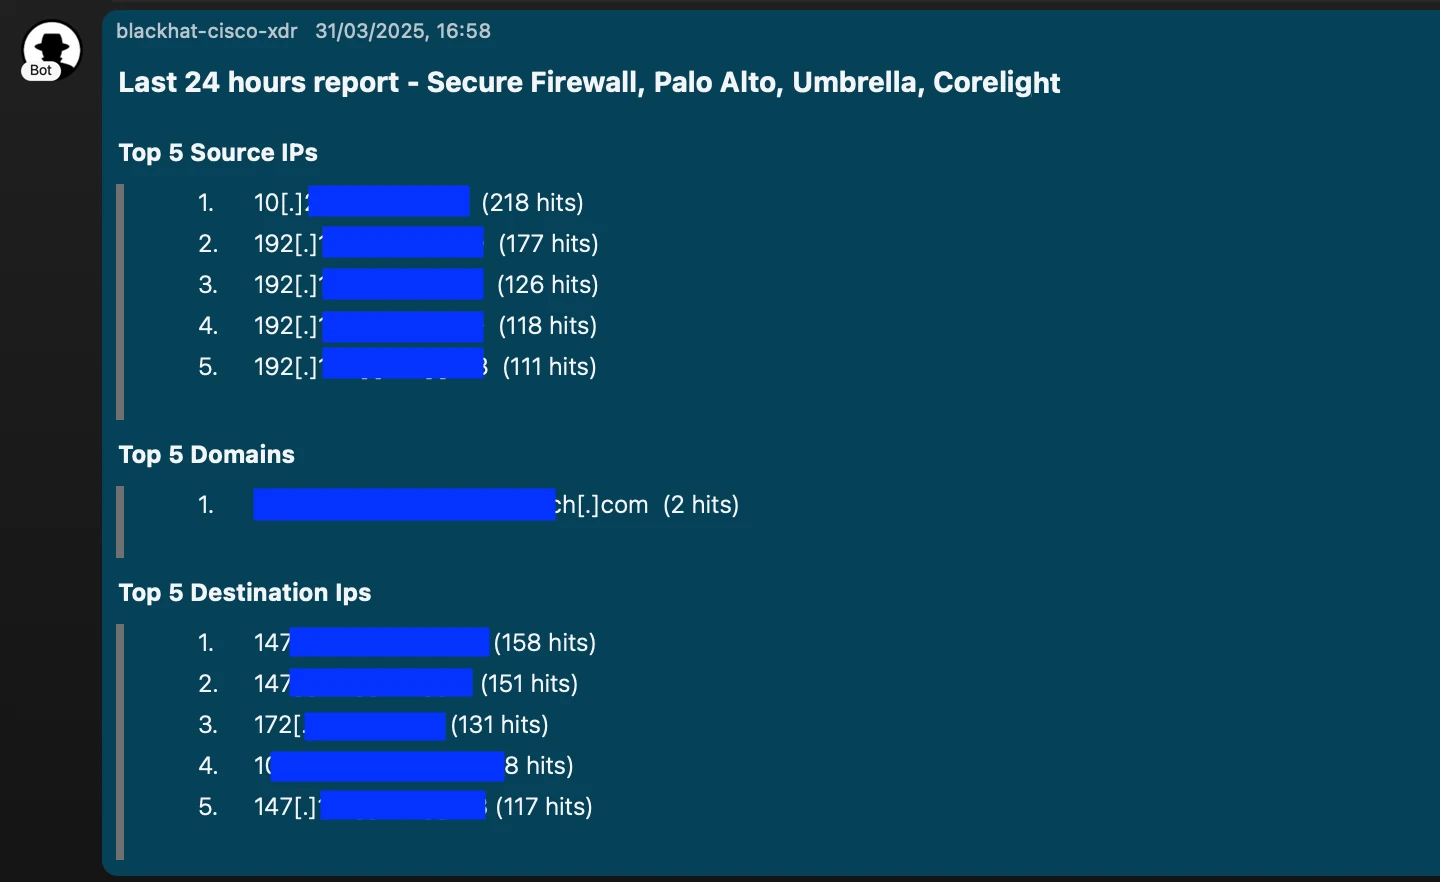 Fig. 24: Last 24 Hours Report from Splunk data
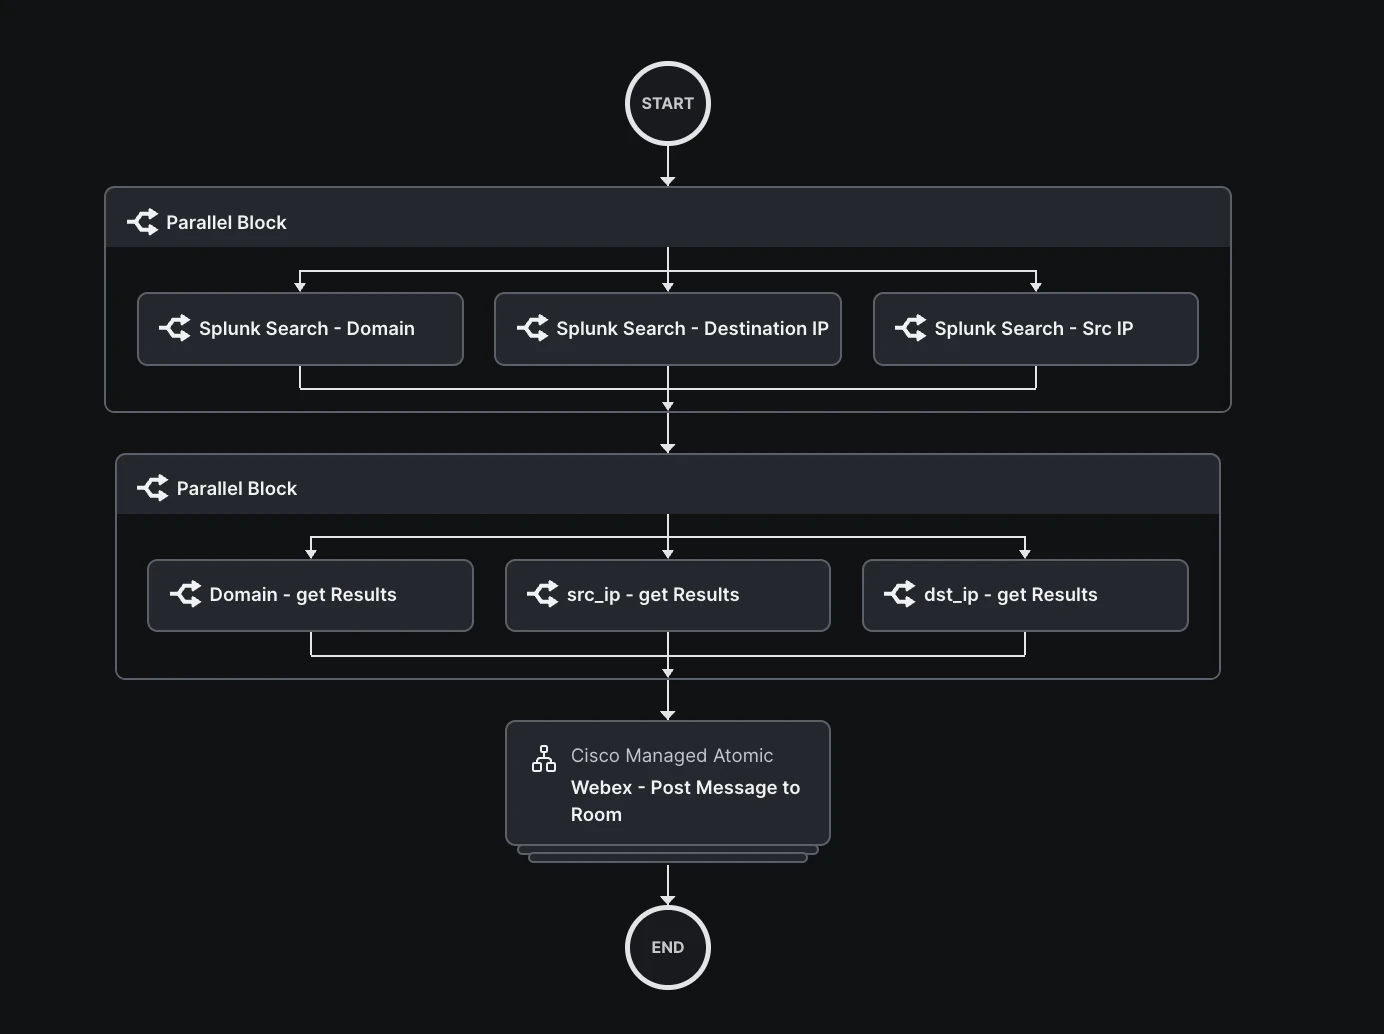 Fig. 25: High level overview of the workflow
Cisco XDR uses several advanced techniques to identify a chain of attack and correlate various related security detections together in a single incident. However, sometimes only the analyst's own investigation can reveal the link between the two. It was important for analysts to have the option, when they discover this link, of merging several incidents into one and closing the previously generated incidents.
We've designed this workflow with that in mind.
During the identification phase, the analyst can run it from the "merge incident" task in the Incident playbook of any of them.
 Fig. 26: Initial Incident before the merge action
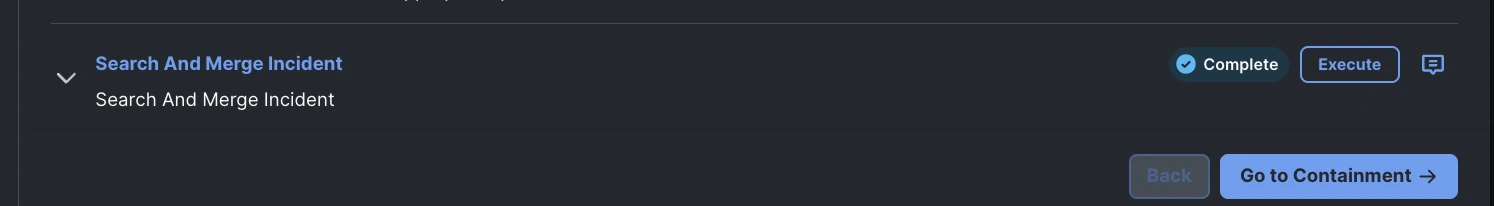 Fig. 27: Playbook action
At runtime, analysts will be prompted to select the observables that are part of the current incident that they wish to search for in other incidents that include them.
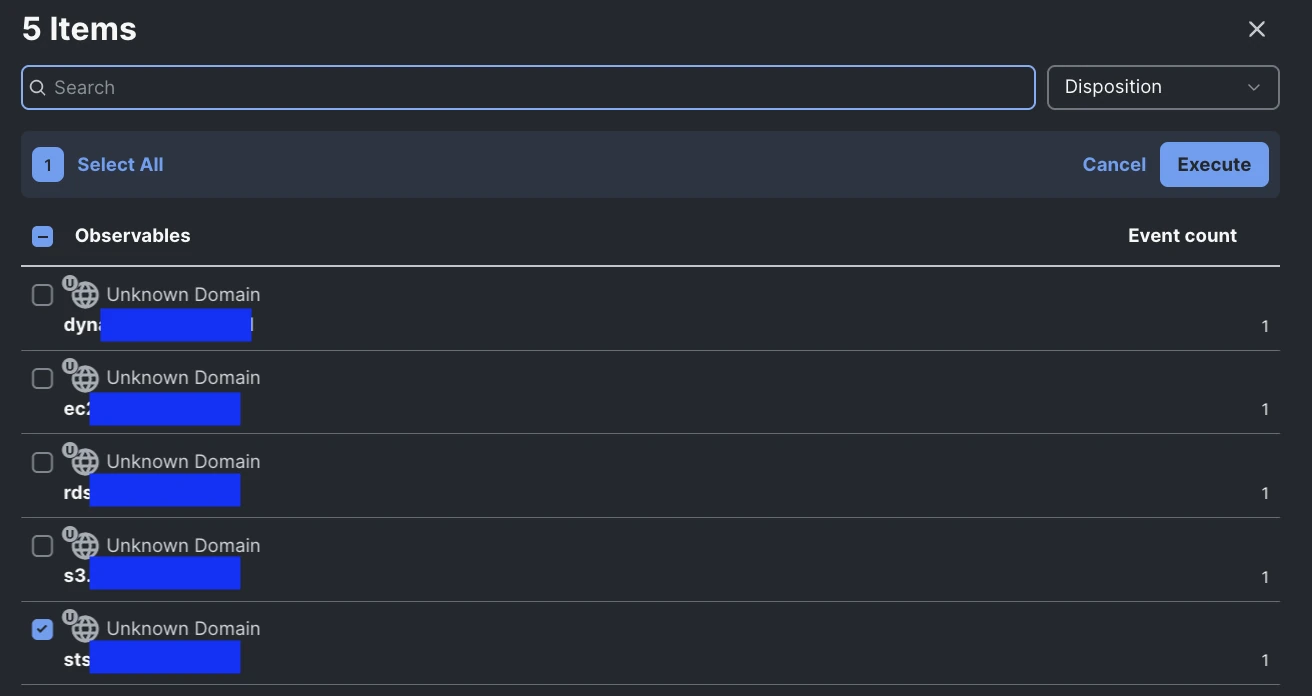 Fig. 28: Select observables upon task execution
The workflow will then search in XDR for other incidents involving the same observables and report incidents found in the current incident notes.
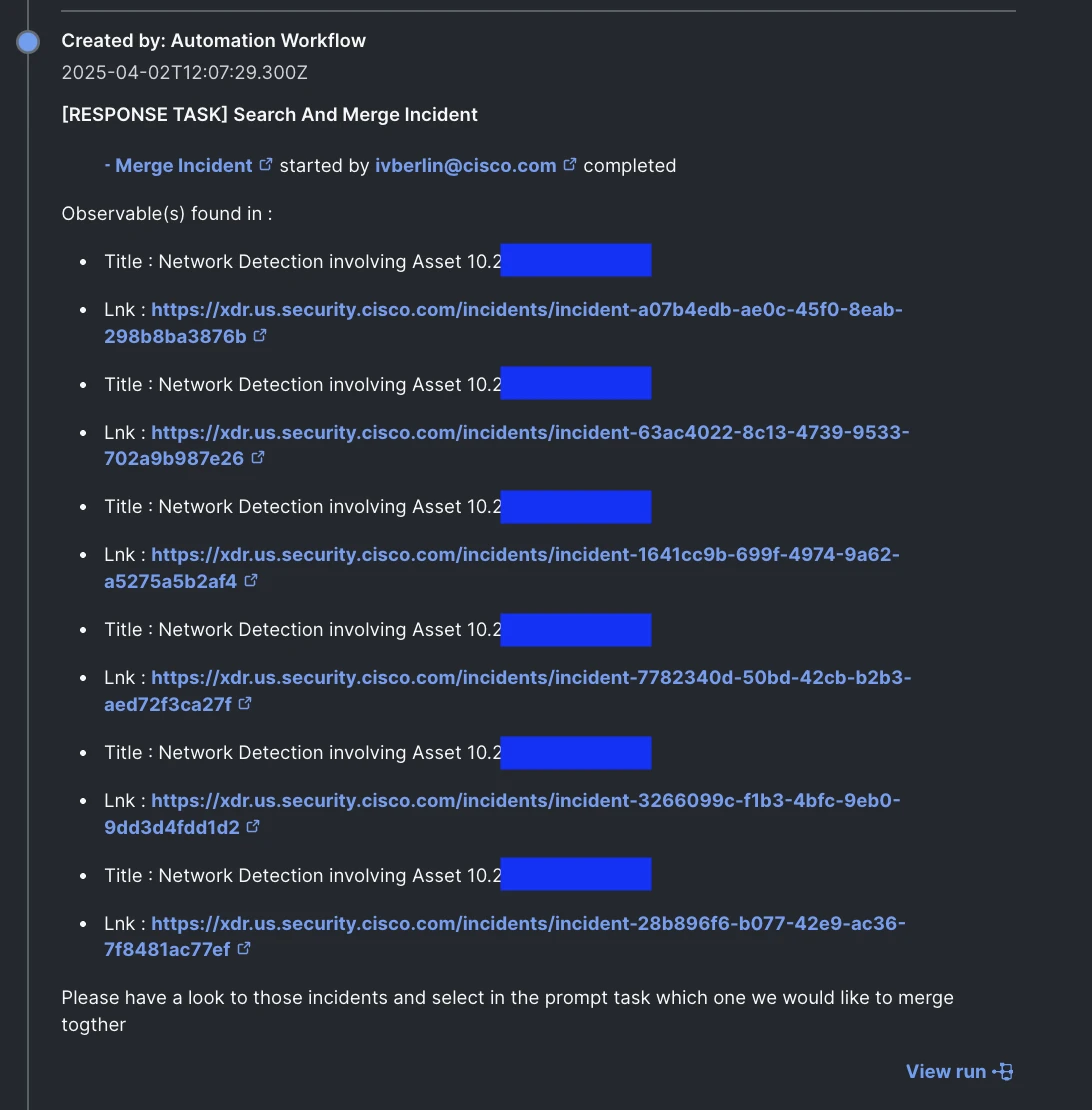 Fig. 29: Incidents found
Analysts are then invited via a prompt to decide and indicate the criteria on which they would like the merger to be based.
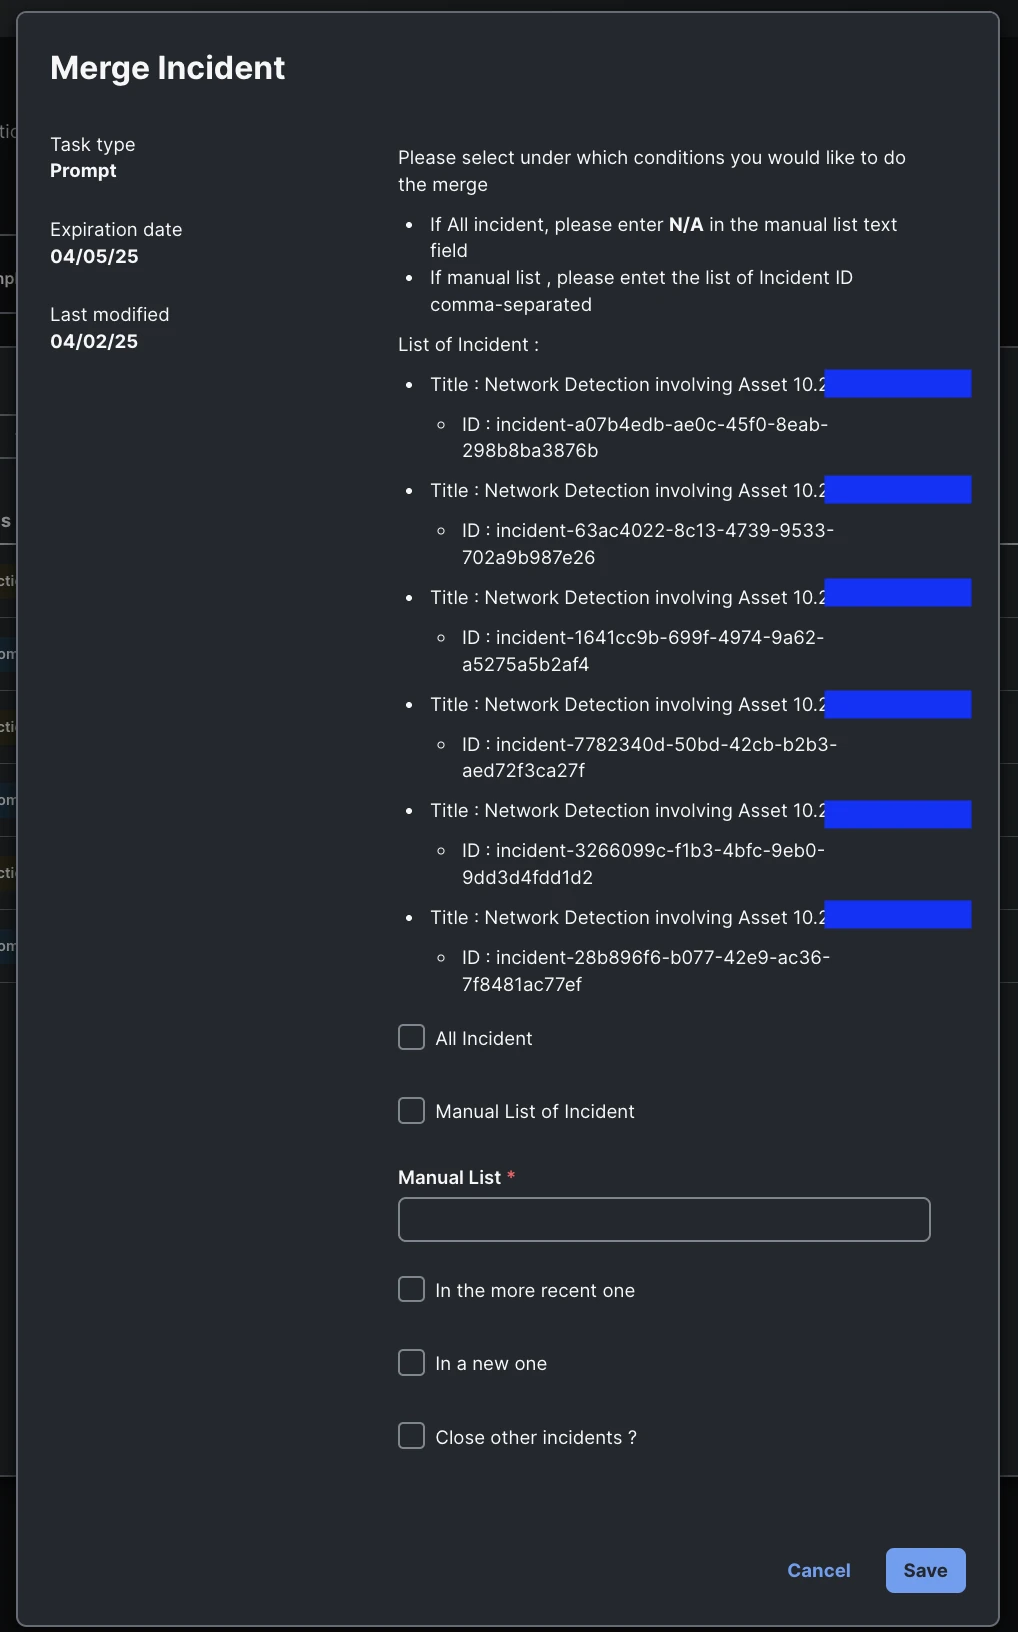 Fig. 30: Prompt example
The prompts include:
The workflow then extracts all the information from the selected incident and creates a new one with all this information (or updates the most recent incident).
 Fig. 31: New incident after the merge
To make our threat hunters' lives richer with more context from ours and our partners' tools, we brought in Splunk Enterprise Security Cloud at the last Black Hat Europe 2024 event to ingest detections from Cisco XDR, Secure Malware Analytics, Umbrella, ThousandEyes, Corelight OpenNDR and Palo Alto Networks Panorama and visualize them into functional dashboards for executive reporting. The Splunk Cloud instance was configured with the following integrations:
The ingested data for each integrated platform was deposited into their respective indexes. That made data searches for our threat hunters cleaner. Searching for data is where Splunk shines! And to showcase all of that, key metrics from this dataset were converted into various dashboards in Splunk Dashboard Studio. The team used the SOC dashboard from the last Black Hat Europe 2024 as the base and enhanced it. The additional work brought more insightful widgets needing the SOC dashboard broken into the following 4 areas for streamlined reporting:
1. Incidents
 Fig. 32: Incidents dashboard
2. DNS
 Fig. 33: DNS dashboard
3. Network Intrusion
 Fig. 34: Network Intrusion dashboard
4. Network Metrics
 Fig. 35: Network Metrics dashboard
With the charter for us at Black Hat being a 'SOC within a NOC', the executive dashboards were reflective of bringing networking and security reporting together. This is quite powerful and will be expanded in future Black Hat events, to add more functionality and expand its usage as one of the primary consoles for our threat hunters as well as reporting dashboards on the large screens in the NOC.
Authored by:Aditya Raghavan and Shaun Coulter
In the Black Hat Asia 2025 NOC, Shaun staffed the morning shifts, and Aditya the afternoon shifts as usual. Unlike the earlier years, both hunters had plenty of rabbit holes to down into leading to a place of "involved joy" for both.
Activities involving malware what would be blocked on a corporate network must be allowed, within the confines of Black Hat Code of Conduct.
It all started with unusual network activity originating from a device in a lab class. Doesn't it always?
"Look beyond the endpoint."
A saying that comes to life daily at Black Hat
That said, a device was found connecting to a website flagged as suspicious by threat intelligence systems. Next, this website was being accessed via a direct IP address which is quite unusual. And to top it all off, the device exchanged credentials in clear text.
Sounds like your typical phishing incident, and it raised our hunters' eyebrows. The initial hypothesis was that a device had been compromised in a phishing attack. Given the nature of the traffic - bi-directional communication with a known suspicious website - this seemed like a classic case of a phishing exploit. We utilized Cisco XDR to correlate these detections into an incident and visualize the connections involved.
 Fig. 36: Possible successful phish screen
As is evident from the screenshot below, a detection from Corelight OpenNDR for possible phishing kicked this off. Further investigation revealed similar traffic patterns from other devices within the conference hall, this time on General Wi-Fi network as well.
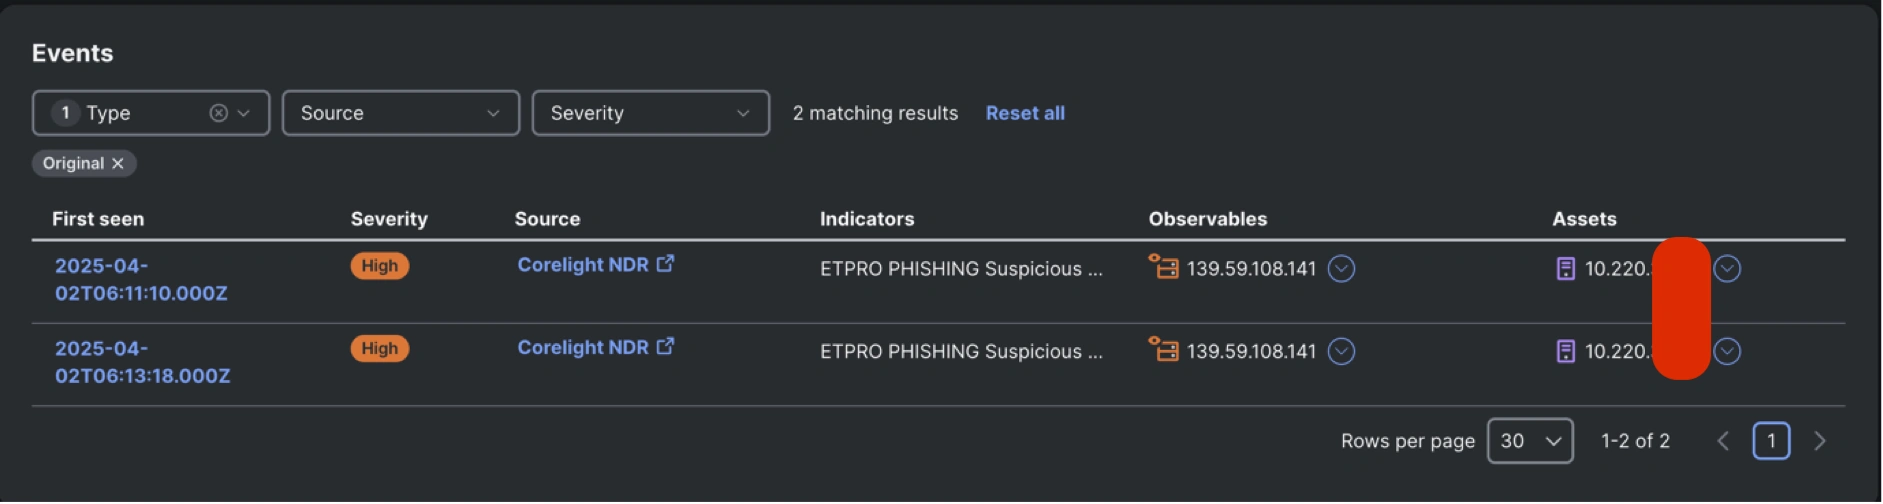 Fig. 37: Corelight OpenNDR detections
The destination for all of them, 139.59.108.141, had been marked with a suspicious disposition by alphaMountain.ai threat intelligence.
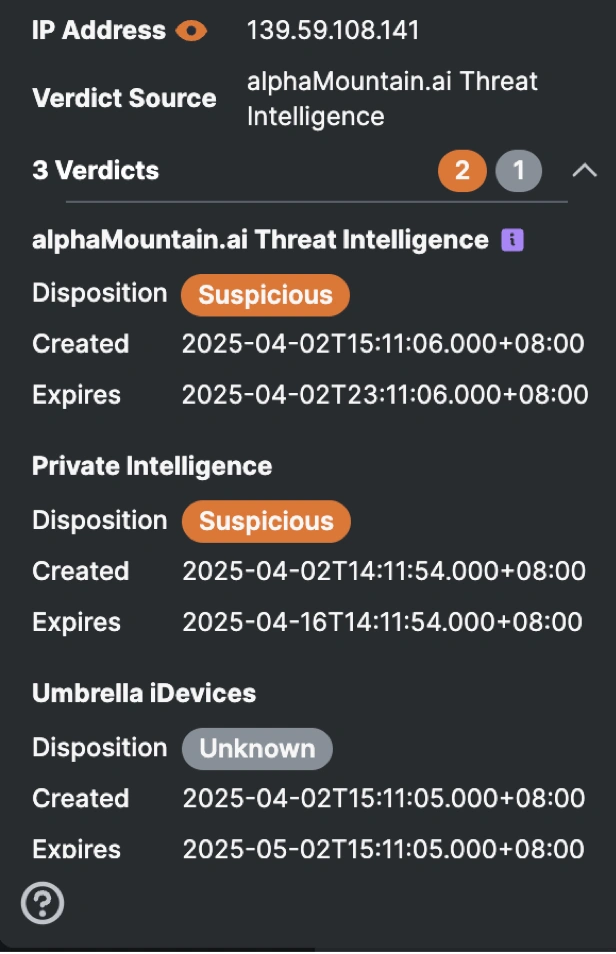 Fig. 38: Suspicious flags
Thanks to the automation implemented to query Umbrella Identities, the device's location was quickly confirmed to be within theAdvanced Malware Traffic Analysisclass. The hunters' used this function every single time to such effect that it was decided to automate this workflow to be run and response obtained for every incident so that the hunters' have this data ready at hand as the first step while investigating the incident.
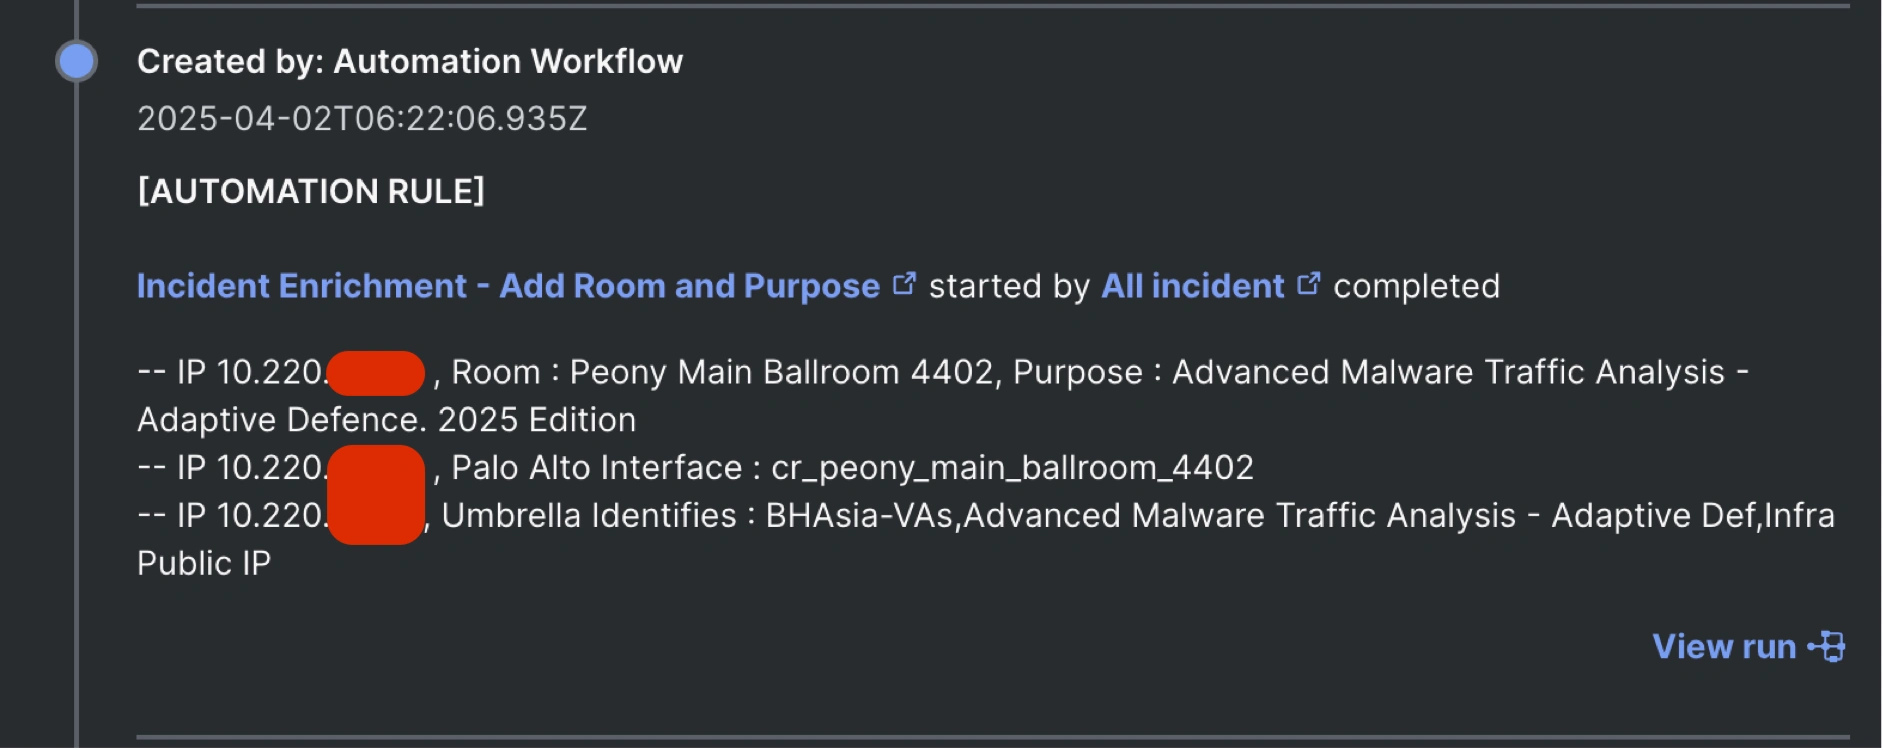 Fig. 39: Automated workflow to identify the device's location
Next step, our threat hunters as expected dived into Cisco Splunk Cloud to investigate the logs for any additional context. This investigation revealed important insights such as the traffic from the device being in clear text, allowing the payload to be extracted. This discovery was key because it revealed that this was not a typical phishing attack but part of a training exercise.
Additionally, it was discovered several other devices from the same subnet were also communicating with the same suspicious destination. These devices exhibited nearly identical traffic patterns, further supporting the theory that this was part of a lab exercise.
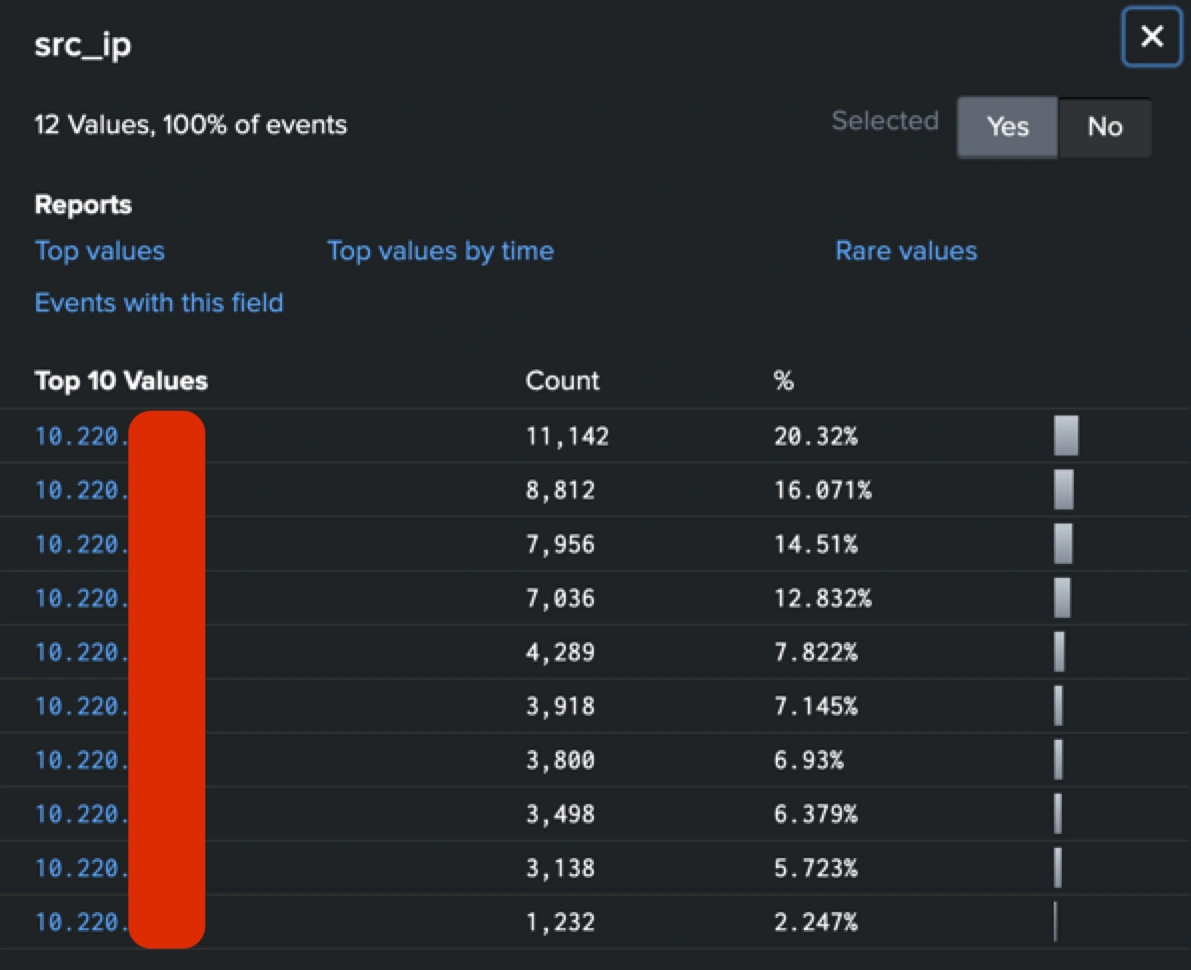 Fig. 40: Traffic patterns
The variation in the traffic volume from the different devices suggested that various students were at different stages of the lab.
Being able to adjust what is presented to an analyst on the fly is one of the most fun parts of working events. In many organizations, "lessons learned" from an incident or cluster of events are reviewed much later if at all, and recommendations enacted even later.
In the Black Hat event environment, we are consistently looking for improvements and trying new things; to test the limits of the tools we have on hand.
At Black Hat our mandate is to maintain a permissive environment, which results in a very tough job in determining actual malicious activity. Because there is so much activity, time is at a premium. Anything to reduce the noise and reduce the amount of time in triage is of benefit.
Repeated activity was seen, such as UPNP traffic causing false positives. Fine, easy to spot but still it clogs up the work queue, as each event was at first creating a single incident.
Noise such as this causes frustration and that in turn can cause errors of judgement in the analyst. Therefore, sharpening the analysts' tools is of premium importance.
The entire BH team is always open to suggestions for improvement to the processes and automation routines that we run on XDR.
One of these was to place the Corelight NDR event payload directly into the description of an event entry in XDR.
This simple change provided the details needed directly in the XDR dashboard, without any pivot into other tools, shortening the triage process.
The above example shows activity in the Business Hall from demonstrator booths. It is clear to see what appears to be repeated beaconing of a vendor device and was therefore easy and quick to close. Previously this required pivoting to the Splunk search to query for the event(s) and if the information was not apparent, then again pivot to the submitting platform. Here is the review of lesson learned, and the application of recommendations, considered my process of investigation and automated those two steps.
Again, In the following example shows interesting traffic which looks like external scanning using ZDI tools.
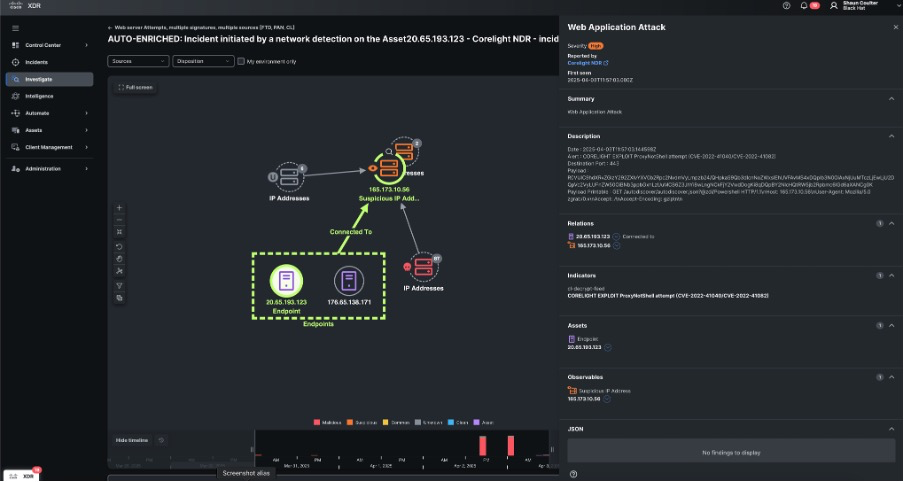 Fig. 42: Traffic scanned using ZDI tools
Through having the payload form Corelight present in the event sequence in the XDR "Analyst workbench", I was able to see:/autodiscover/autodiscover.jsonwhich is commonly used by Microsoft Exchange servers to provide autodiscovery information to clients like Outlook.
The presence of this path suggested a probing for Exchange services.
The tool is likely part of the ZMap ecosystem, which more than likely means that it is someone performing scanning or reconnaissance operation on the Public IP for the event, making it worthy to continue monitoring.
The Event Name was "WEB APPLICATION ATTACK" not very descriptive but with our fine tuning by providing the detail directly in the incident findings, the information was quite literally at my fingertips.
On 2nd April, one of the devices on the network reached out to a website flagged as "Phishing" by Umbrella.
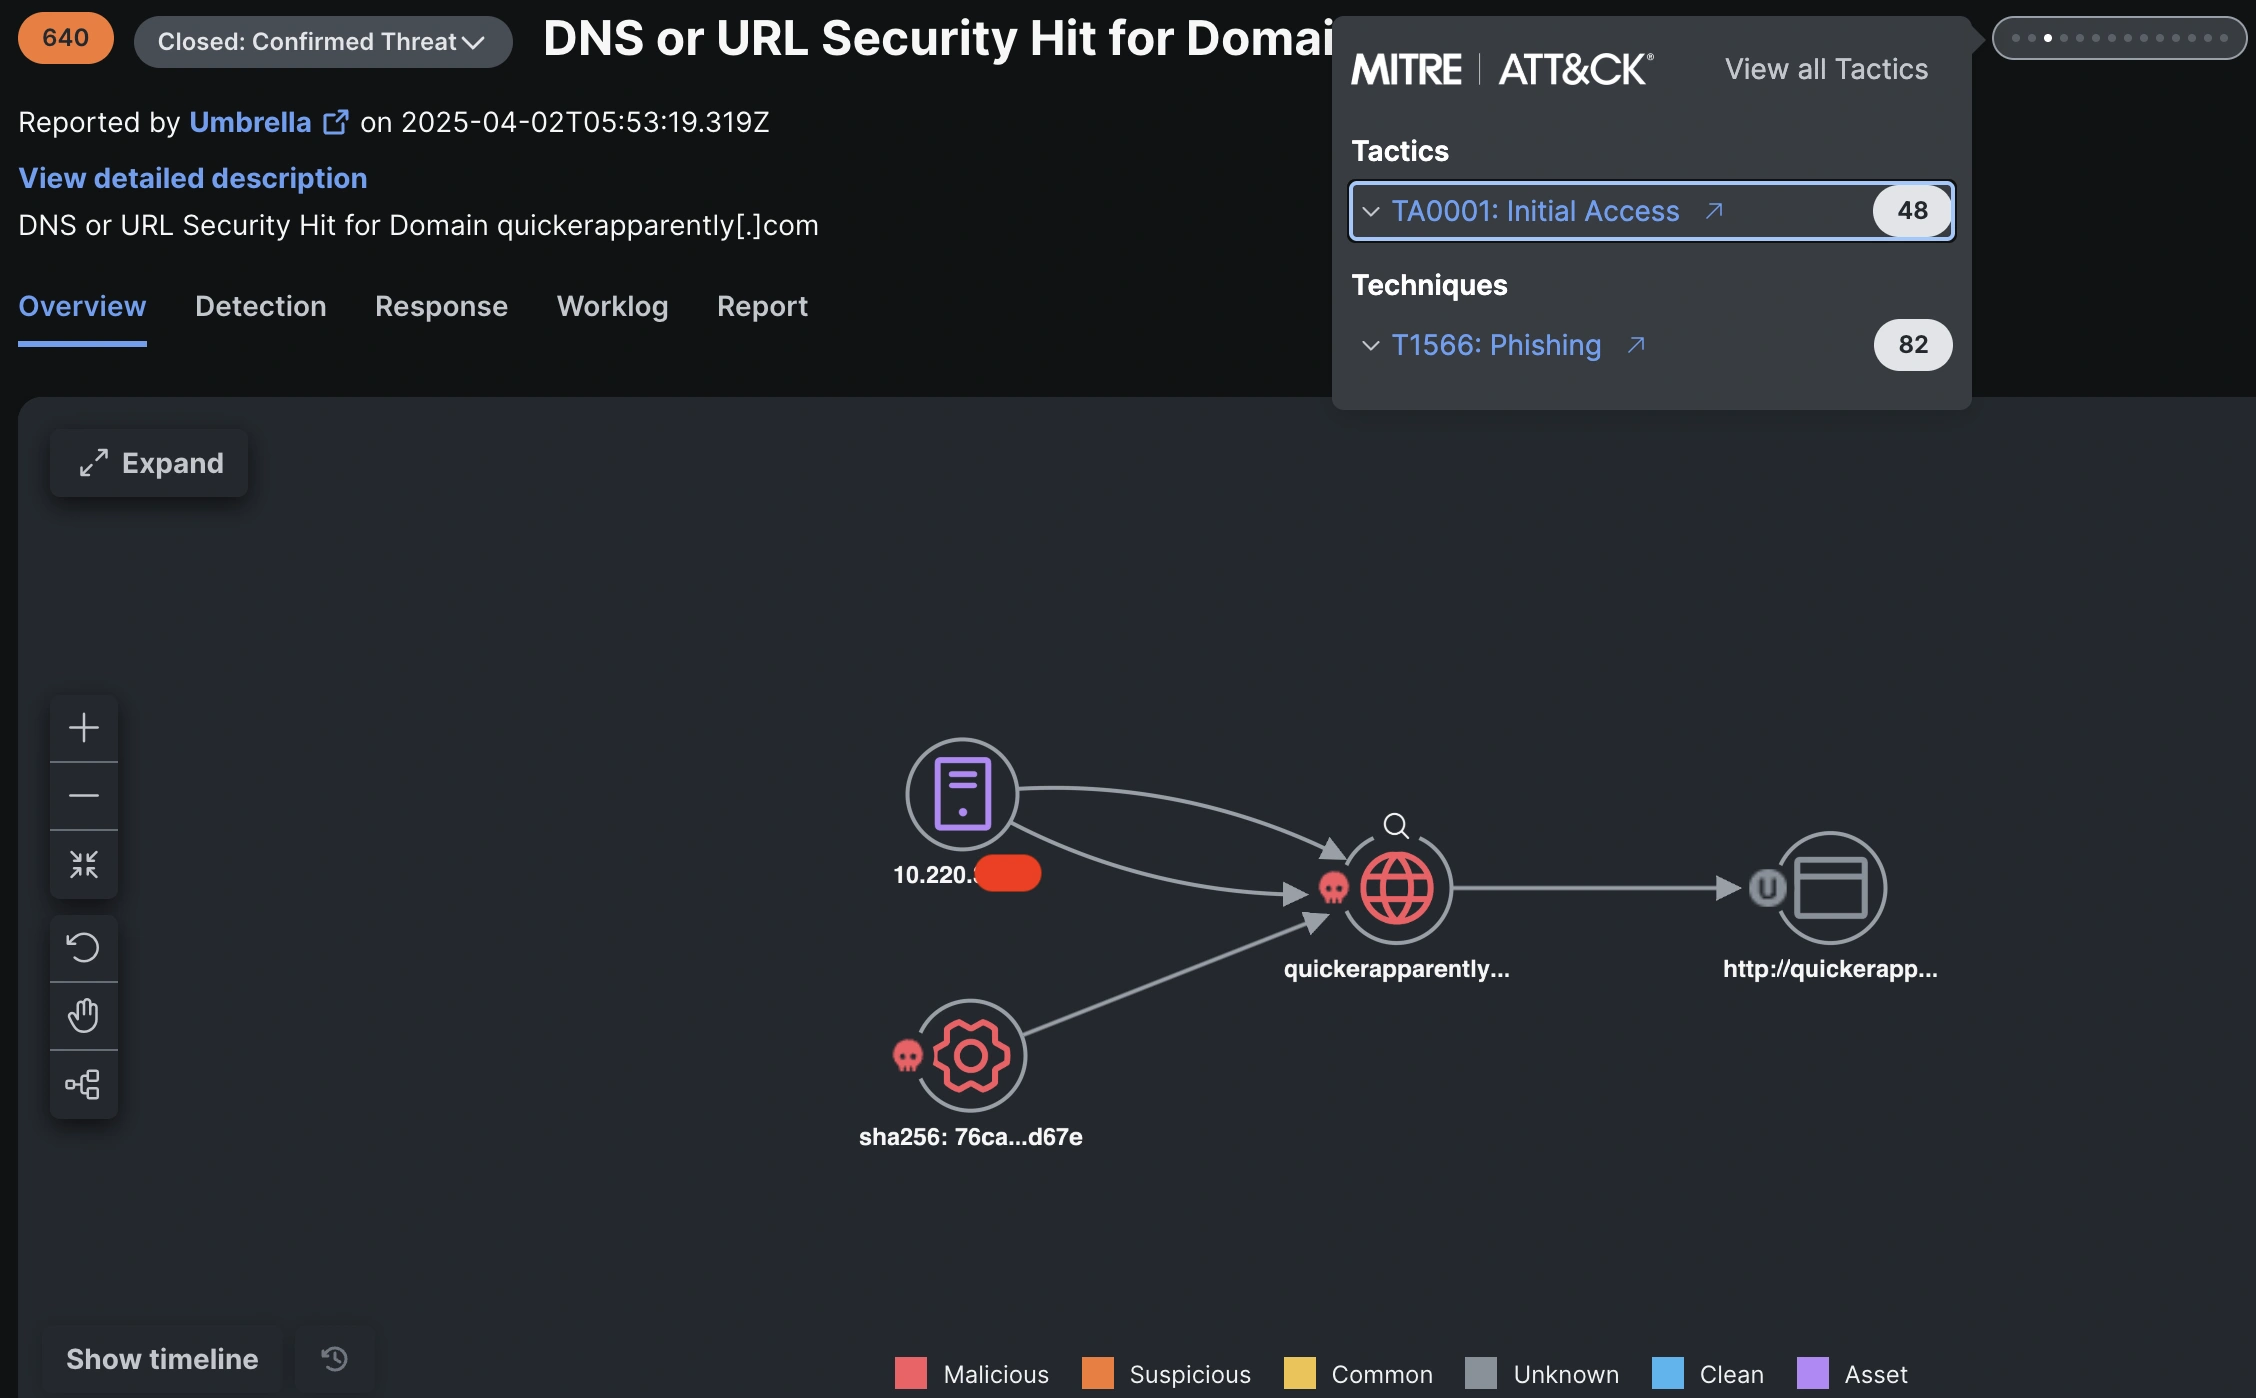 Fig. 43: Umbrella-generated phishing flag
At first, it was suspected that the queries were related to a training class because of the timing of the domain activity. For example, some of the domains were registered as recently as a month ago, with Umbrella showing activity beginning only on April 1s
 Tags quentes :
Cisco Talos
Cisco XDR
Black Hat
Cisco Security Cloud
Cisco Secure Access
Cisco Breach Protection
Cisco User Protection
Cisco Meraki Systems Manager
Mobile Device Management MDM
Tags quentes :
Cisco Talos
Cisco XDR
Black Hat
Cisco Security Cloud
Cisco Secure Access
Cisco Breach Protection
Cisco User Protection
Cisco Meraki Systems Manager
Mobile Device Management MDM
Cadastre-se agora para Ações Semanais de Promoção
100% free, Unsubscribe any time!
Add 1: Room 605 6/F FA YUEN Commercial Building, 75-77 FA YUEN Street, Mongkok KL, HongKong Add 2: Room 405, Building E, MeiDu Building, Gong Shu District, Hangzhou City, Zhejiang Province, China
Whatsapp/Tel: +8618057156223 Tel: 0086 571 86729517 Tel em HK: 00852 66181601
Email: [email protected]
 English
 Pусский
 Français
 Español
 Português